Definition: Average True Range (ATR) is an indicator that compares trading ranges for each successive day or time period. ATR is a volatility indicator developed in the late 1970s by J. Welles Wilder, Jr., to help deal with volatile futures markets.
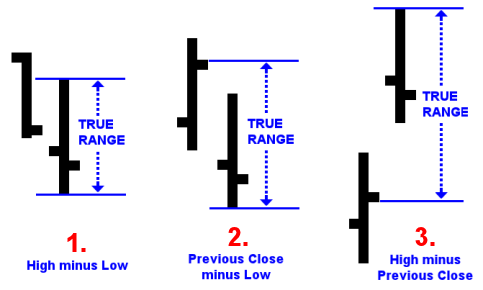
We find that the True Range is the greatest value of three calculations:
2. Difference between the previous Close minus the current Low, or
3. Difference between the current High minus the previous Close
The ATR is a moving average calculation of the true ranges over a given period. The ATR is usually a simple or exponential moving average that defaults to 14 periods.
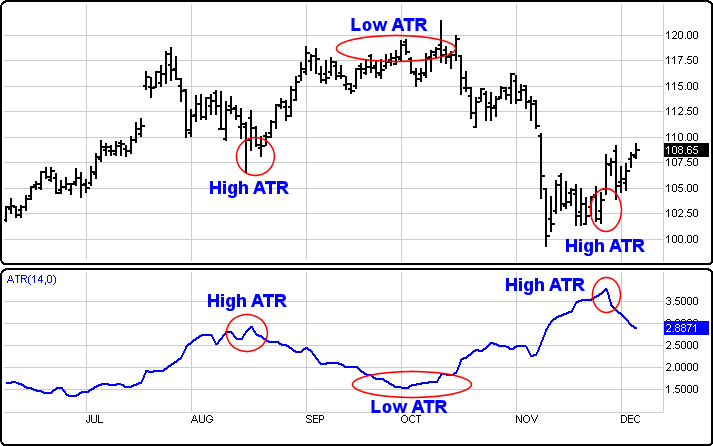
The ATR cannot forecast a direction or duration of movement; it only specifies a level of activity.
Extreme levels (either a high or a low) can signify a possible reversal or beginnings of a new trend. High ATR levels can be the result of fast moves or strong trading activity in a wider range.
Low ATR levels for extended periods of time identify quiet markets in a small range. Low ATR values for an extended period of time may signify a consolidation phase or setup.
Menu:
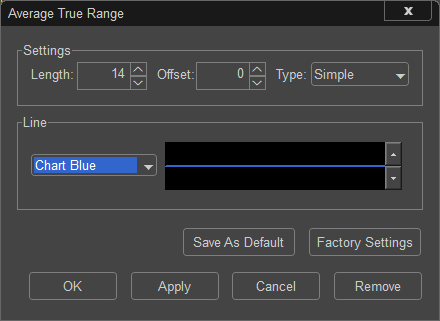
Settings
The Default Length is 14 (trading days) and the Offset is 0. These values can be changed by clicking in their respective boxes and changing the values. The Type can be changed from Simple to Exponential or Weighted.
Line
The Color selection allows the user to change the color of the band, and the Thickness selection allows the user to change the thickness of the band displayed.
To save your modified settings to be applied to future charts, click Save As Default. Once this is clicked at all times in the future the settings you have set will be applied to future charts when this study is added.
To return to the Factory Settings, click Factory Settings and then click Save As Default. Once this done at all times in the future the Factory Settings will be applied to future charts when this study is added.
Click "OK" to apply the Average True Range to the selected chart, or click "Cancel" or "Remove" to exit the study without applying it.
Click "Remove" to remove the study from the selected chart.