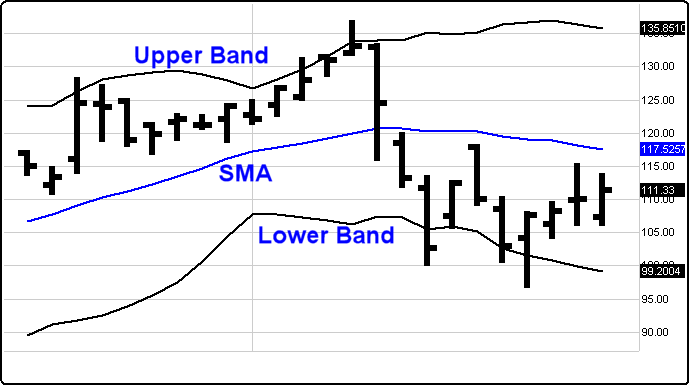
Definition: Bollinger Bands were invented by John Bollinger and consist of a set of three bands drawn in relation to a securities price. Three bands comprise the Bollinger Bands: the Upper Band, the Slow Moving Average (SMA), and the Lower Band. The middle band is a measure of the intermediate-term trend, usually a simple moving average that serves as the base for the upper and lower bands. The purpose of Bollinger Bands is to provide a relative definition of a dynamic, ever changing high and low range within that moving average. By definition, prices are high at the upper band and low at the lower band.
Bollinger Bands are essentially standard deviations plotted above and below a simple moving average. Bollinger originally recommended using a twenty-day simple moving average and set the bands at two standard deviations.
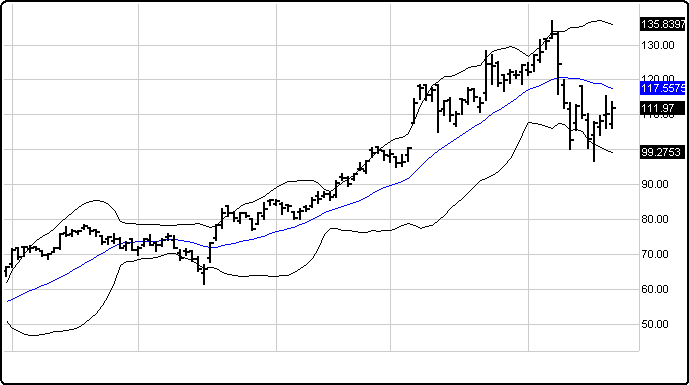
How to Use: Bollinger Bands form a bandwidth or envelope that expands and contracts around a simple moving average. The expansion of the bands is based on the volatility of the equity. As the equity becomes more volatile, the bands widen. As the equity becomes less volatile and more stable, the bands will contract closer to the simple moving average.
When we compare this price action to the action of other indicators and attempt to match patterns, we can improve our trading decisions in a systematic way. For example, we can use Bollinger Bands to confirm trading signals from a momentum indicator. The bands typically indicate overbought and oversold levels relative to a moving average.
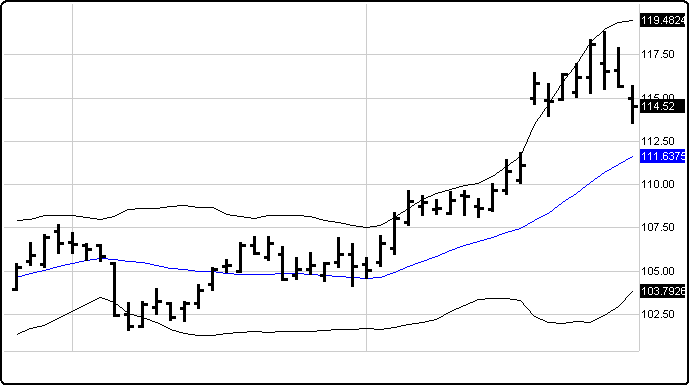
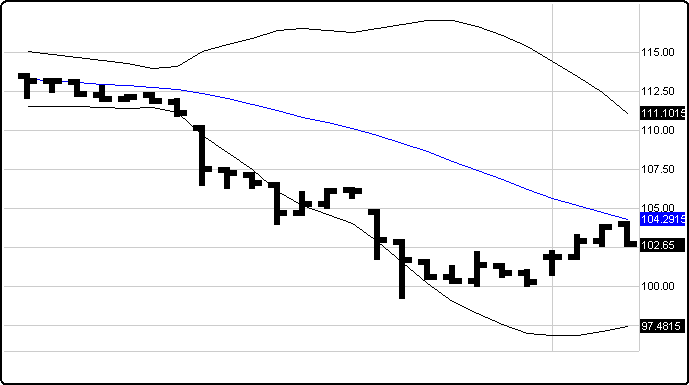
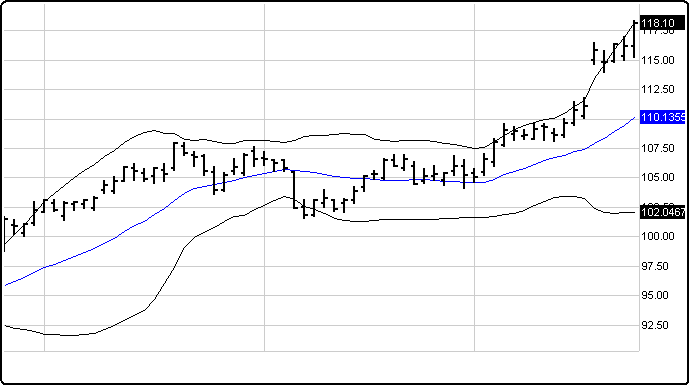
Examples:
Bollinger noted the following characteristics of Bollinger Bands:
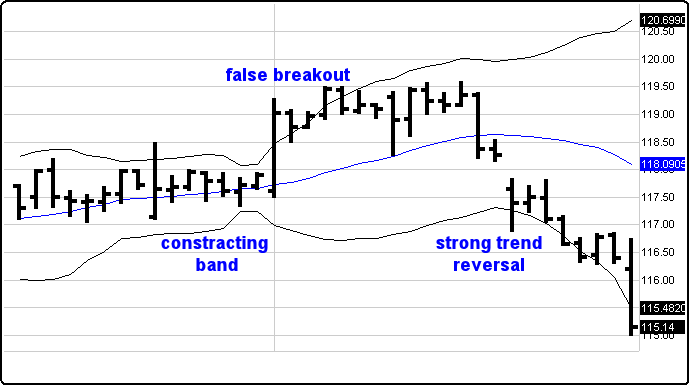
* Sharp price changes tend to occur after the bands tighten as volatility lessens.
* When prices move outside the bands, a continuation of the current trend is implied.
* Bottoms and tops made outside the bands followed by bottoms and tops made inside the bands call for reversals in the trend.
* A move that originates at one band tends to go all the way to the other band. This observation is useful when projecting price targets.
Contracting bands warn that the market is about to trend: The bands first converge into a narrow neck, followed by a sharp price movement. The first breakout is often a false move, preceding a strong trend in the opposite direction.
A move that starts at one band normally carries through to the other in a ranging trading pattern.
A move outside the band indicates that the trend is strong and likely to continue unless the price quickly reverses.
A trend that hugs one band signals that the trend is strong and is likely to continue. One should wait for divergence on a Momentum Indicator to signal the end of a trend.
Menu:
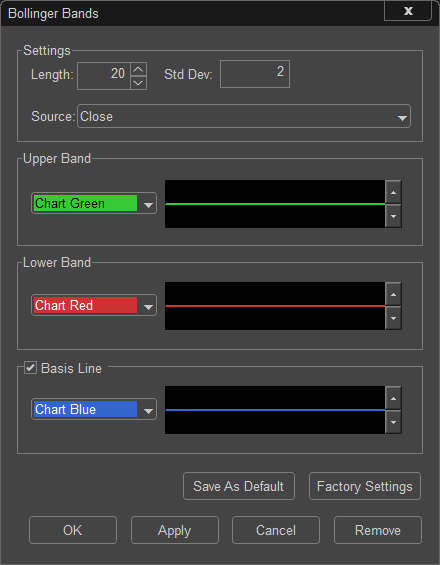
Settings
The Default Length is 20 (trading days), and the Standard Deviation is 2. These values can be changed by clicking in their respective boxes and changing the values.
The Source can be set to one of the following options: Price - Open, Price - High, Price - Low, Price - Close.
Upper Band
The Color selection allows the user to change the color of the band, and the Thickness selector allows the user to change the thickness of the band displayed.
Lower Band
The Color selection allows the user to change the color of the band and the Thickness selector allows the user to change the thickness of the band displayed.
Basis Line
If the Basis Line Checkbox is unselected, the Basis Line will be removed from the Bollinger Bands.
The Color selection allows the user to change the color of the band, and the Thickness selector allows the user to change the thickness of the band displayed.
To save your modified settings to be applied to future charts, click Save As Default. Once this is clicked at all times in the future the settings you have set will be applied to future charts when this study is added.
To return to the Factory Settings, click Factory Settings and then click Save As Default. Once this done at all times in the future the Factory Settings will be applied to future charts when this study is added.
Click "OK" to apply the Bollinger Bands to the selected chart, or click "Cancel" or "Remove" to exit the study without applying it.
Click "Remove" to remove the study from the selected chart.