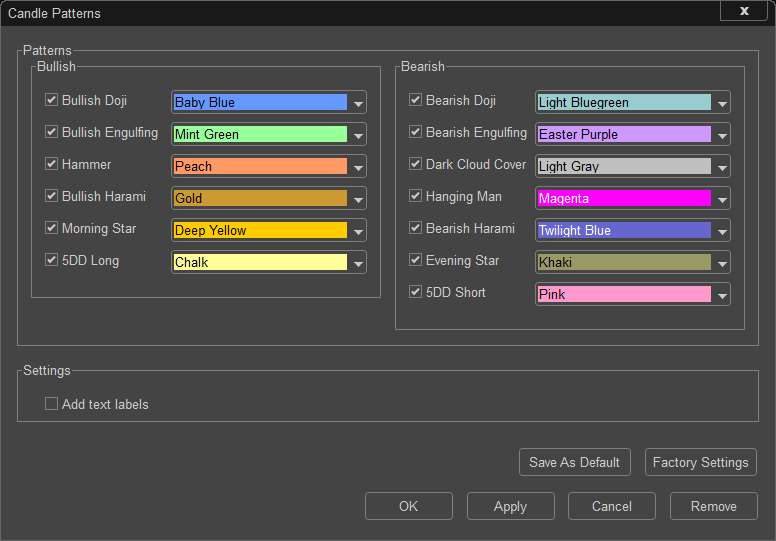
To apply the Candle Patterns to your chart right click on the selected chart and select Add Study, then choose Candle Patterns. Select one or more Candle Patterns to be displayed and click Ok.
Japanese Candlesticks
The Japanese developed in the 1600’s a method of technical analysis to analyze the price of rice contracts called candlestick charting. Each candlestick represents one period of data.
A Japanese man by the name of Homma discovered the markets were influenced by the emotions of the traders. He realized the benefit from understanding the emotions to help predict the future prices. He understood there is difference between perceived value and the actual price of rice. That behavioral difference is applicable today with trading stocks just as much as it was trading rice in Japan centuries ago.
A normal data bar in charting consists of an opening, a high and low price, followed by a closing price for that time frame. The vertical part of that data bar represents the high and low range during the trading activity time being tracked. Then, to the right and left of a traditional data bar is a left and right horizontal extension line off of the vertical data bar. The left horizontal line represents the open price for that time frame; right horizontal line represents the close price for that time frame being charted.
The Japanese Candlestick data bar is different because it uses the same open, high, low, and closing prices in a format similar to a traditional bar chart; yet, it displays the body in a more graphic way to help visualize help the relationship between the opening and closing prices. Candlestick charts are simply a new way of looking at prices, they don't involve any calculations.
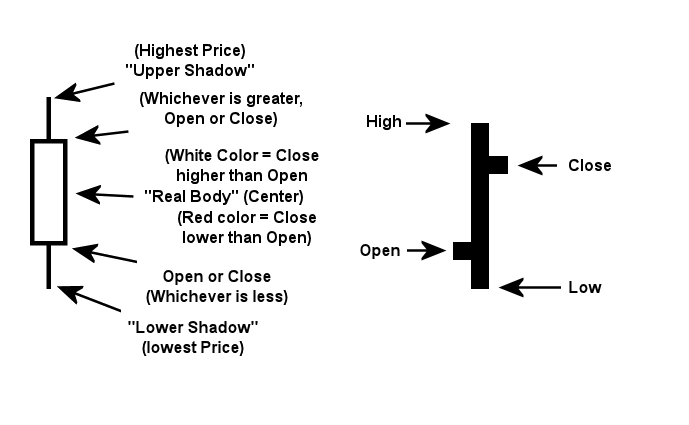
One of the main differences between the traditional data bar and the Japanese Candlestick line is the relationship between open and closing prices. The traditional data bar places the greatest importance on the closing price of a stock in relation to the prior periods close. The Japanese place the highest importance on the close as it relates to the open of the next day, or the next intra-day data bar.
The candlestick chart can be interpreted based on patterns defined from centuries of observations. These patterns are categorized as Bullish, Bearish, or Neutral.
Whether to use a candlestick chart verses a regular bar chart is often times a subjective decision. Some like candlestick charts by themselves, and others will apply the same technical analysis techniques with it as they would with a bar chart. Those who prefer a candlestick chart will use the added dimension of interpreting the chart formation under a candlestick pattern. For those who gain some experience with this technique they will discover some usefulness with this tool.
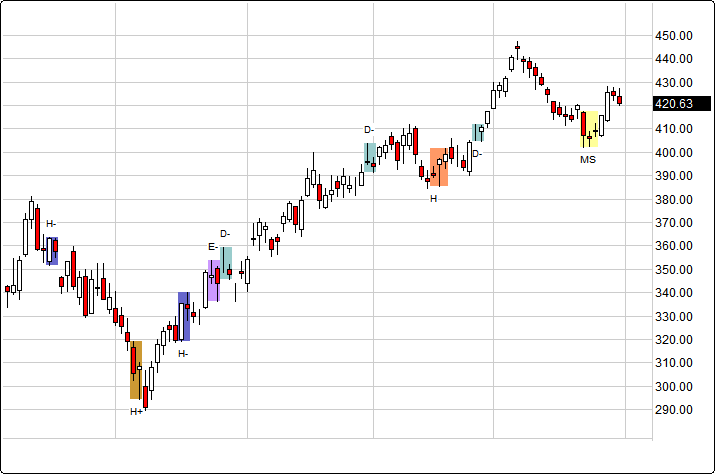
Below are types of identifiable candlestick formations when using the Candle Patterns feature.
Candle Patterns Explained
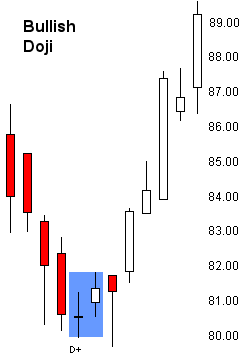
Bullish Doji Pattern is a short candle with a spinning top formation. Also called a highway or Doji because, during a down trend a gap may occur that often times is followed by a long red (down) candlestick. This short candlestick resembles a spinning top or “star” formation. This type of pattern identifies a possible change-in-trend or a candidate for a possible reversal setup. Essentially the star formation is identifying a changing market environment. It implies that the downward driving energy has reduced enough where buyers may consider taking action. A third data bar, a white bar, is often required to confirm its reversal. This pattern can be a more reliable when it occurs.
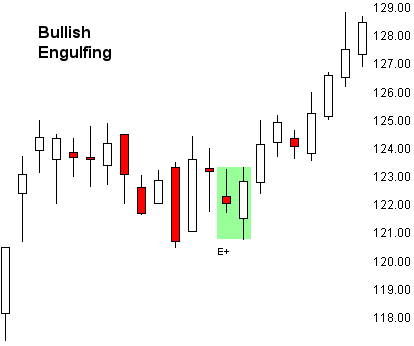
Bullish Engulfing Pattern is a large bodied white (up) candle “engulfing” the preceding small red (down) bodied candle. The pattern sets up with a downtrend in progress. When a small red (down) candle followed by a larger candle that is larger the previous bar, it may be signaling a loss in momentum, the increased potential for change-in-trend reversal. If volume really jumps up from the narrow candle to the larger candle, odds increase quickly a reversal pattern is setting up. For this pattern to be more effective the next day needs to take out the previous larger candle high. This pattern can be less reliable when it occurs. One way to improve your odds trading this kind of a candle pattern would be to focus on a consolidation phase within a previous strong uptrend, as opposed to trying to pick an engulfing setup reversal using a very weak trend.
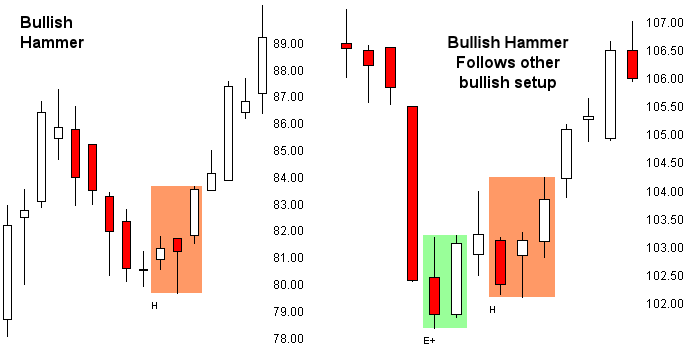
Bullish Hammer Pattern is one of the more interesting bullish candle patterns that can occur at the end of a down trend. What typically can happen in this pattern is the market will open with a sharp sell off yet the price then reverses strongly back to the upper range. If the market fails to return the weakness this could be a strong indication of a bottom in the down trend, or a stronger reversal to the upside is eminent. The Bullish Hammer pattern has a real small body at the upper part of the range. It is called a hammer because the pattern takes the appearance of some trying to hammer out a bottom. A true hammer candle pattern should have a lower body twice the length of the candle body. While this is one of the more interesting candle patterns it, nevertheless, it is not a highly dependable pattern. It therefore needs longer to confirm this setup, and often looks better if it has a larger white candle, a large gap, or a higher close on the next candle. A hammer can be a good confirming signal if it immediately follows other bullish candlestick patterns such as the Bullish Engulfing pattern.
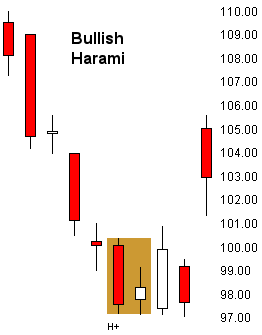
Bullish Harami Pattern is an easy candle to remember because it resembles a pregnant woman. The word “harami” means “pregnant” in Japanese. Basically the long red (down) candle becomes the mother and the next smaller candle becomes the baby belly. The key with this pattern is the market will often have a negative sentiment. The long red (down) candle shows up will heavy volume, yet the next candle bar shows up inside the previous candle range, showing the bearishness is not able to follow-through with the previous strong weakness. To make this pattern more effective you would prefer a smaller ‘belly’ instead of a larger second candle. As with most candle patterns, watch the next candle to make sure it is larger than the previous one. This can be very important if the Harami candle pattern is go become a more reliable setup. Normally a Bullish Harami candle pattern is not very reliable. To improve your success with this setup monitor for a bear market pullback into a congestion phase, followed by the Bullish Harami pattern setup.
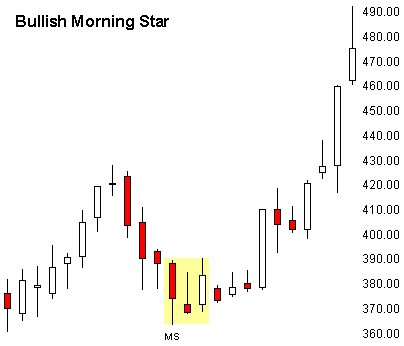
Bullish Morning Star Pattern is a three candle formation typically signaling a major bottom. This pattern is composed of three candles—the first candle had a long red (down) body, the second candle has a smaller body that gaps lower to form what appears to be a star pattern; and then the third candle ends up becoming a reversal up candle that closes into the first candles real body. The colors of the candles are not as important as the reversal and gap covering behavior. This pattern is a more highly reliable pattern.
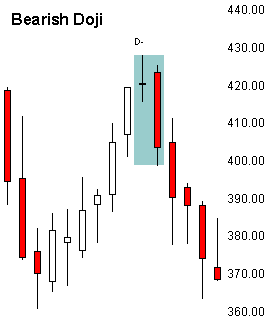
Bearish Doji Pattern is a short candle with a spinning top formation. It is called a Doji because; during a up trend a gap may occur immediately after a long white (up) candle. This short candlestick resembles a spinning top or “star” formation. This type of pattern identifies a possible change-in-trend or a candidate for a possible reversal setup. Essentially the star formation is identifying a changing market environment. It implies that the upward driving energy has reduced enough where sellers may consider taking action. A third data bar, a red bar, is often required to confirm this reversal. The Bearish Doji pattern is a reliable when it occurs.
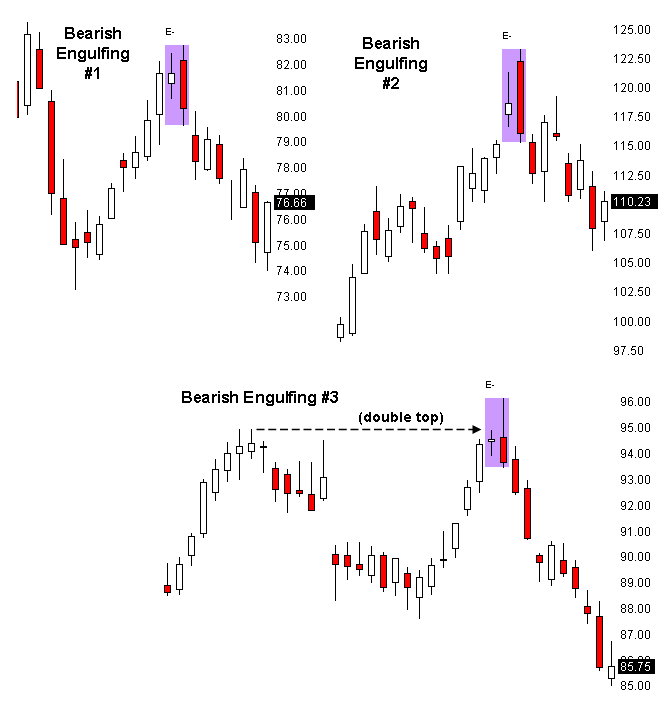
Bearish Engulfing Pattern is a large bodied red (down) candle “engulfing” the preceding small red (down) bodied candle. The pattern sets up with an up-trend in progress. When a small white (up) candle is followed by a larger red (down) candle that is larger the previous bar, it can be a signal momentum is being lost and there is now an increased potential for some kind of a change-in-trend reversal. If volume really jumps up during the narrow candle to the larger candle, odds increase quickly a better reversal pattern is setting up. For this pattern to be more effective the next day needs to take out the previous larger
candle high. This pattern can be less reliable when it occurs so you want to trade it using other technical tools to help manage any new trade ideas. For instance, if the new trend does not improve within 3 to 5 additional candle bars it may be suggesting a false reversal setup.
One way to improve your odds trading this kind of a candle pattern would be to focus on trying to trading the reversal Bearish Engulfing setup within a consolidation phase rally as opposed to a good swing trading trend. Consider, also, managing any Bearish Engulfing trades more aggressively so you can preserve even a small profit in case the bigger reversal never materializes. Below are three examples of different Bearish Engulfing setups. The first Engulfing Bear is a counter trend rally within a previous bigger downtrend. This type of setup increases your odds of trading the reversal setup with greater success as it typically is only a counter trend rally within a larger downtrend so you are, in all probability, catching the next downtrend continuation. The second example is of a strong up trend where and Bearish Engulfing setup may only be signaling a needed healthy profit-taking pullback before the larger up trend may continue. In this example if you do not manage your Short more aggressively you could very well lose all your profits once the up-trend returns. A third possible way to improve on an Bearish Engulfing pattern is to watch for a strong trend that has gone on for a long time, where it forms a “double top” formation. If you see a Bearish Engulfing setup in this instance that also becomes a more favorable candle reversal setup.
Bearish Dark Cloud Cover Pattern is a two candle pattern formation that can very often identify a top that is about to reverse. What normally occurs is we see a consistent uptrend. Then one day we have a long white (up) candle which is followed by a long red (down) candle which makes a newer high but will reverse and trade down 50% or more the previous candle length and close with a weak long candle. Most often a gapping action is involved as well. To confirm this pattern we watch to see if a gap down occurs or a lower close happens. The Bearish Dark Cloud Cover pattern is rare yet when it occurs it becomes a more highly reliable reversal setup.
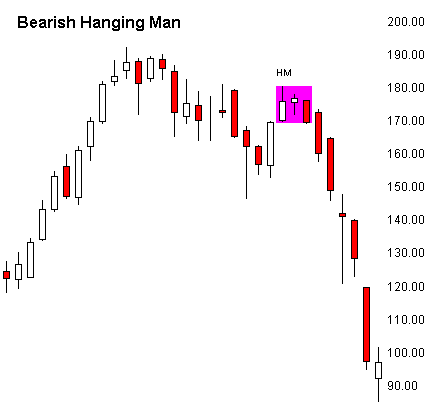
Bearish Hanging Man Pattern is a single candle bearish reversal pattern that has a very small upper body near the top of its candle, with little or no upper shadow and, ideally, a lower shadow at least two to three times the upper body length. This pattern shows up most often after a nice advance. It can show up near a top or later on after a top has started to form. The Bearish Hang Man has lower reliability of predicting a reversal but it is worth paying attention to if it shows up. To confirm the reversal monitor the next day or two for greater proof, such as another red candle, a large gap down or a lower close than the previous day or two.
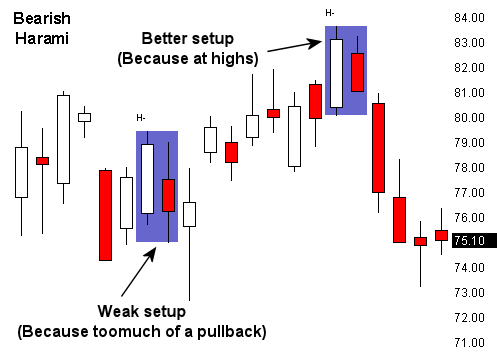
Bearish Harami Pattern is an easy candle to remember because it resembles a pregnant woman. The word “harami” means “pregnant” in Japanese. The long white (up) candle becomes the mother and the next smaller candle becomes the baby belly. For a Bearish Harami the belly might be located more on the upper range of the previous candle bar. The key with this pattern is the market will often have a bullish sentiment. If the long white (up) candle shows up with heavy volume, yet the next candle bar shows up inside the previous candle range, it suggests the bullishness may very well not be able to follow. To make this pattern more effective you would prefer a smaller ‘belly’ instead of a larger second candle. As with most candle patterns, watch the next candle to make sure it is larger than the previous one. This can be very important if the Harami candle pattern is go become a more reliable setup. Normally a Bearish Harami candle pattern is not very reliable. To improve your success with this setup monitor for a bear market pullback into a congestion phase, followed by the Bullish Harami pattern setup. Another idea to think about if trying to trade a Bearish Harami is to manage your trade very aggressively with a tight trailing stop until it confirms a greater breakdown is obtainable. If a stronger reversal does not show up within 3 to 5 data bars this pattern could only become a short-term phase before the previous uptrend returns. Bearish Harami setups are not highly effective in very strongly trending markets but they can be useful if a market is running out of steam near and at the top of a bull trend.
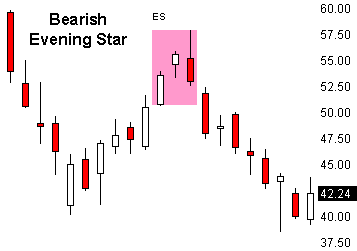
Bearish Evening Star Pattern is a three candle formation typically signaling a major bottom. This pattern is composed of three candles - the first candle had a long white (up) body, the second candle has a smaller body that could be white as well, or a star shaped formation; the third candle ends up becoming the red (down) reversal candle that closes into the first candle’s real body. The colors of the candles are not as important as the reversal and gap covering behavior. The Bearish Evening Start pattern can be a more highly reliable pattern.
Menu:
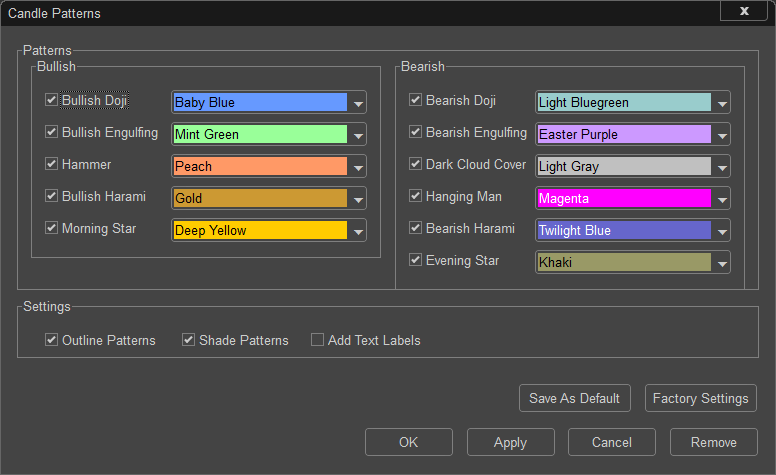
Bullish
Available patterns: Bullish Doji, Bullish Engulfing, Hammer, Bullish Harami and Morning Star.
Bearish
Available patterns: Bearish Doji, Bearish Engulfing, Dark Cloud Cover, Hanging Man, Bearish Harami and Evening Star.
Settings
Checking this box enables Text Labels under the selected Candle Patterns.
Outline Patterns will either display or not display a solid outline on each candle.
Shade Patterns when checked will shade the center of the pattern with a transparent shading of the pattern color.
To save your modified settings to be applied to future charts, click Save As Default. Once this is clicked at all times in the future the settings you have set will be applied to future charts when this study is added.
To return to the Factory Settings, click Factory Settings and then click Save As Default. Once this done at all times in the future the Factory Settings will be applied to future charts when this study is added.
Click “OK” to apply the Study to the selected chart, or click “Cancel” or “Remove” to exit the study without applying it.
Click “Remove” to remove the study from the selected chart.