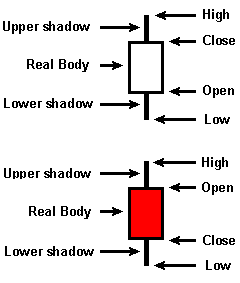
Originally from Japan, Candlesticks is a chart method in which the high and low are plotted as a single line and are referred to as shadows. The price range between the open and the close is plotted as a narrow rectangle and is referred to as the body. If the close is above the open, the body is white. If the close is below the open, the body is red. Each candlestick represents one period (e.g., day) of data. This is shown in the graphic below.
The advantage to this form of charting is that it provides more visual information about the trading period as well as many trading signals to help decision making. There are many trading strategies based on candlestick charting patterns.
This type of chart can be selected from the toolbar or by right clicking on the chart and selecting "Candlesticks" or by choosing the "Chart" tab from the menu bar and selecting "Candlesticks."
![]()