The Commodity Channel Index (CCI) is a technical analysis indicator designed by Donald Lambert and featured in his book, "Commodities Channel Index: Tools for Trading Cyclical Trends." The CCI was originally designed for commodity traders to identify cyclical turns in commodities or currencies - to detect beginning and ending market trends - but it is not limited to just those markets. Other trading instruments such as bonds, indexes and stocks can be analyzed as well.
Two primary ways to use the CCI
(1) Determining if a stock or futures contract is oversold or overbought.
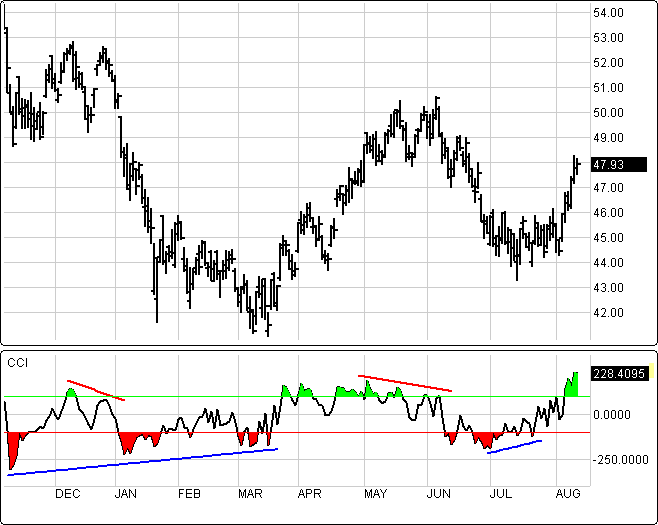
(2) Finding divergences that may be lead to possible reversal moves.
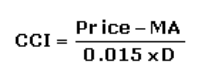
A standard CCI calculation is as follows: Price = asset Price; MA = Moving Average price; D = standard deviation from that average. The default CCI is normally set at 20 or 21 days with Overbought/Oversold band levels set at 100/-100.
The CCI can be a filter when fluctuations fall inside the +/- 100 percent range. It measures price oscillations around an average price movement and uses a range from -100 through +100. The CCI measures a price and identifies how far away from a moving average it is extending, and how fast it moved to get there. It takes a standard deviation of the price from its average statistical price to calculate this information. When the CCI is at 0 the price is touching the moving average.
Prices closer to +100 in the range indicate more buying of a commodity and prices closer to the -100 point in the CCI range indicate more selling has taken place. The constant (0.015) tends to restrict 75-80% of the price movement scores to within <+100 (overbought) and >-100 (oversold).
The indicator has no boundaries so theoretically it can oscillate to within a +200/300 or a -200/300 range, although that would be considered extreme.
There are two general ways a trader can interpret the Commodity Channel Index (CCI). First, do we see bullish divergence or bearish convergence within a trend? That is one type of a CCI setup. The CCI divergence or convergence can typically be picking up the possibility of the beginning of a correction, or at least a good temporary change-in-bias. The second way the CCI is useful in identifying overbought and oversold extremes, within ranges. It does this because it is similar to the Bollinger Bands. The difference is CCI displays more as an indicator line and not as a band. For example, in a flat or non-trending market, a typical trader might work out of a position near the overbought or oversold conditions, or attempt a buy or sell setup within one of these overbought or oversold areas.
CCI Drawback
The CCI can be more effective in a market subject to cyclical patterns. A drawback to CCI is it can generate a number of false signals, particularly when a market pushes to extremes but has not run out of steam within that extreme. It is because of this many will only use the CCI as more of a secondary or confirming indicator.
Menu:
Settings
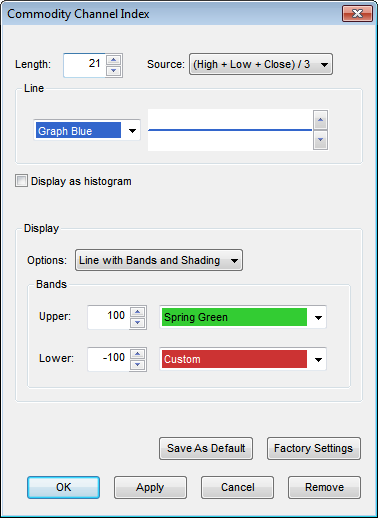
The Default Length is 21 (trading days). This value can be changed by clicking in the respective box and changing the value.
The Source can be set to one of the following options: Price - Open, Price - High, Price - Low, Price - Close, (H+L)/2, (H+L+C)/3.
Display
The Display Type can be set to one of the following options: Line, Line with Bands, Line with Bands and Shading, Line with Shading.
Bands
The default Upper Band is set at 100 while the Lower band is set at -100. These values can be changed by clicking in their respective boxes and changing the values. The Color selection allows the user to change the color of the band displayed.
To return to the Factory Settings, click Factory Settings and then click Save As Default. Once this done at all times in the future the Factory Settings will be applied to future charts when this study is added.
Click Ok to apply the study to the selected chart or click Cancel or Remove to exit the study without applying it.
Click Remove to remove the study from the selected chart.