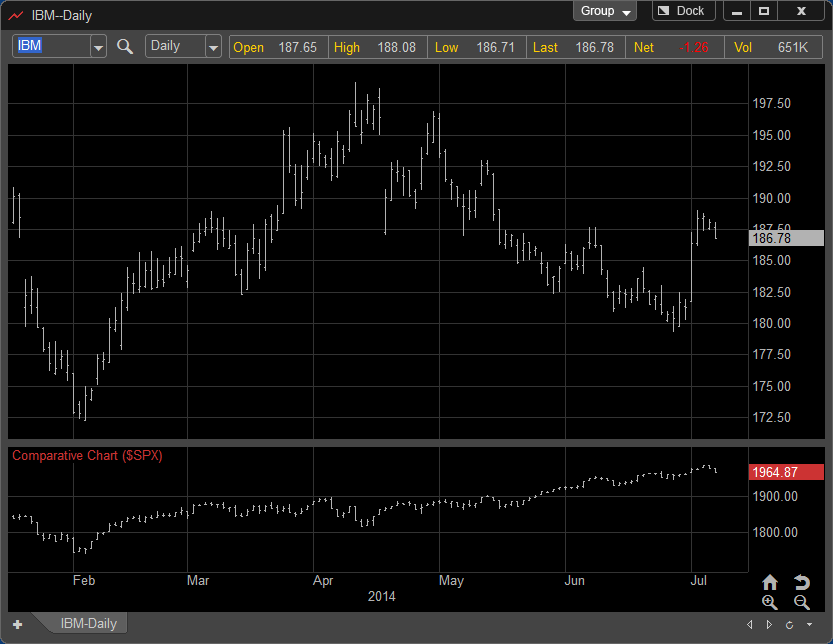
Comparative Chart is a study that allows a “quick look” comparison of an individual stock with the overall S&P500 market. The study will also allow other comparisons to be done with another stocks, sector ETF’s and other indices.
The primary purpose for allowing comparison is to quickly identify how well a stock is performing when compared to other stocks or the market as a whole. Is it performing better or lagging? By having this ability to quickly compare investment opportunities a trader can better evaluate is it worth tying up assets or not on a stock that might not be producing as profitable results, for example, as quickly as other stocks.
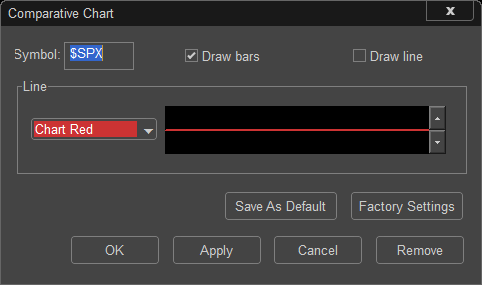
Comparative Chart Settings Dialog: