Definition: The Fibonacci Extension is a technical analysis tool designed to identify or predict price movements and market momentum. It can be used as a basis for determining price projections along with support and resistance levels. Fibonacci Extension numbers can be used as targets for taking profits, or for identifying potential price levels where the next major moves may be able to transition.
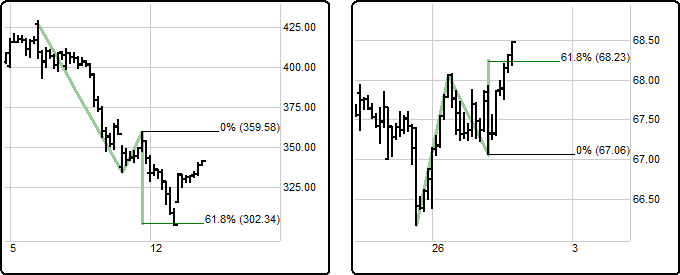
Fibonacci Extension Down Fibonacci Extension Up
How to Use: The Fibonacci Extension projects ratios of a previous price swing. The function takes three input points to draw the projected prices.
![]()
1. Click on the Fibonacci Extension button and your cursor will change from an arrow to the Fib Ext. then click on a high or low point on the chart to set the first point of the Fibonacci Extension. Move your mouse to the next point. If you clicked on a high, you should be looking for a low; likewise, if you clicked on a low, you should be looking for a high.
2. Click on the second point (either a high or low). This will be the distance used for calculating the swing length.
3. The third point will be used for the projection. Once identified, click on the chart, and horizontal lines will appear, signaling key Fibonacci Extension levels (e.g., 0.62, 1.0, 1.62, or higher). You can continue with the analysis by using other techniques, tools, and methodologies to evaluate potential opportunity further.
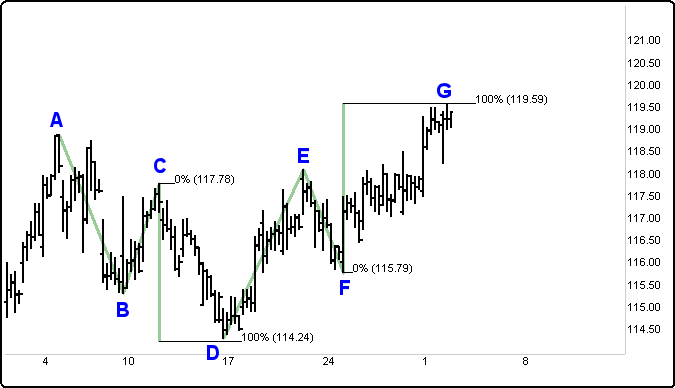
In the following IBM example, focus on how to apply Fibonacci Extensions. The IBM 90 minute time frame exemplifies intermediate level Fibonacci Extensions. Attempt to find possible support or resistance targets in potentially interesting trades.
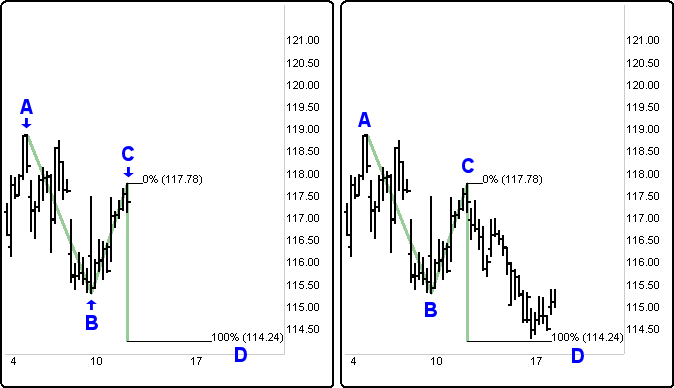
To find this target level, left click with the mouse on the high (A), move the mouse down to the next low (B), and click a second time. Then take the mouse back to the current high (C) and click on the high point. This three-click Fibonacci Extension application produced a target level (D). In this example, IBM moved down from $117.78 to within several cents of our 100% $114.24 (D) target.
Editing Fibonacci Values
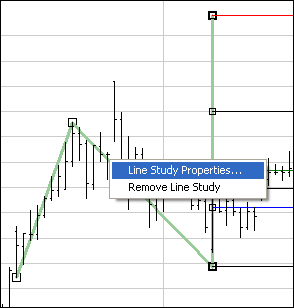
Once the Fibonacci Extension lines have been drawn on the Chart, right click on the line and select Line Study Properties.(shown below)
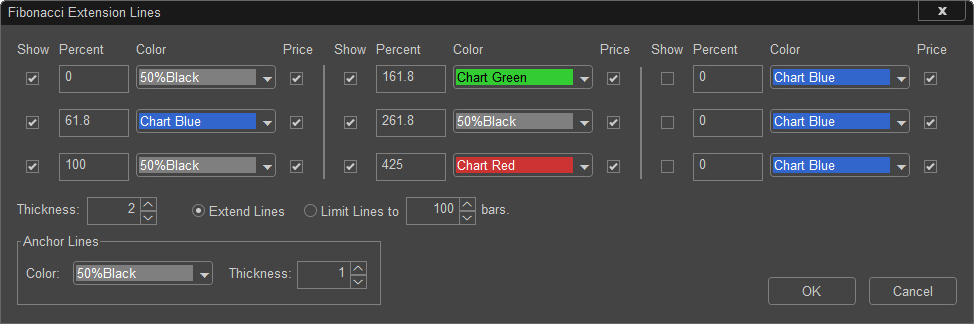
When viewing the Line Study Properties dialog box there are many options available. You can modify any of the lines listed above. When adding or editing a line you can set whether you want it to be displayed, the percent, whether to show the price, the color of the line and the thickness of the lines.
Fibonacci numbers are a sequence of numbers in which each subsequent number is the sum of the two previous numbers; for example, 1, 1, 2 or 3, 5, 8 or 13, 21, 34 or 55, 89, 144 are all Fibonacci sequences. These numbers also possess an intriguing number of natural interrelationships such as the fact that any given number is approximately 1.62 times the preceding number, and any given number is approximately 0.62 times the following number.
The most common Fibonacci ratios used in the stock markets are as follows:
0.15, 0.25, 0.38, 0.5, and 0.62 (ratios for retracements)
1 - 1.62, 2.62, 4.25, and 6.85 (ratios for extensions)
In the following example, the rally off the 1.00 ($114.24) support. This uptrend continues for a period of time. To define resistance targets, use a new Fibonacci Extension calculation. Start a Fibonacci Extension calculation by clicking the mouse at the low of the new bottom (D). Click the mouse a second time on the current new high (E). Click at the bottom of the pullback low (F). Using the Fibonacci Extension 1.00 ($119.59), a possible resistance target area is now displayed (G).
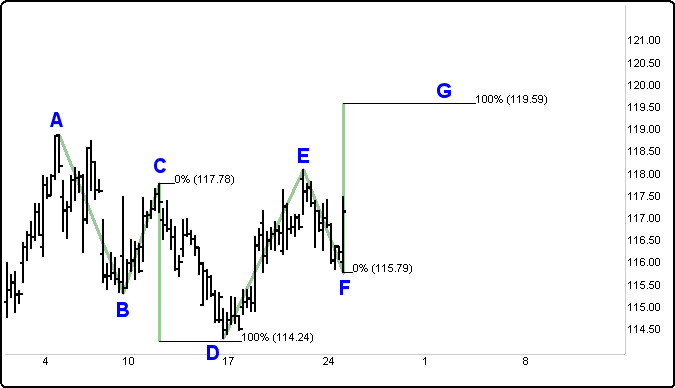
As the stock moves to meet up with the target (G), several options are present: you can take profits, move the stop up in order to protect profits, start to scale out of a position and move the stop up to protect the rest of the position, or prepare to establish a new trade in the opposite direction.