Just like the Japanese candlestick charts the Heikin Ashi Chart type displays chart data in a candle form. It is calculated by looking at prior periods and the current period to form the candle. Its main purpose is to visual display a better look at what the trend is doing.
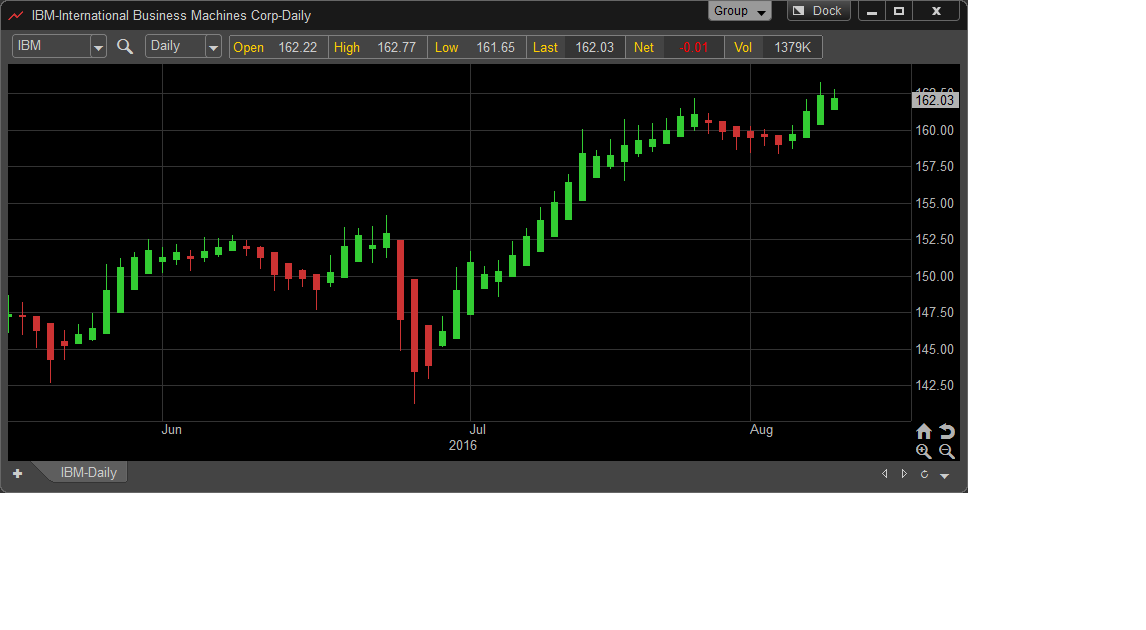
Up Trend = Green
Down Trend = Red