Historic Volatility (HstVo) is an indicator used chiefly to evaluate how volatile or unpredictable a market has been for a previous period of time. It is used primarily for those who trade options and other derivative instruments. Unlike other indicators designed to give a standard signal, HstVo does not give trading signals.
Volatility can be a measurement of market risk. High volatility occurs during higher degrees of uncertainty, instability, or unpredictability because of such as market turmoil, threats of war or violence are just a few of the many factors that can play into a volatile market.
Legendary investor George Soros, when addressing the issue of volatility, said: "Short term volatility is greatest at a turn around and diminishes as a trend becomes established." Volatility, in general terms, is a term used to describe big market movements. The reason why volatility can become an important issue is because often increases in volatility can be a warning major changes could be developing in a market. It often is a precursor to a new major trend eventually showing up.
Volatility, in general, is a statistical measure of fluctuations or tendencies in a stock or futures market price to rise and fall sharpy within a period of time. It can be measured over the shorter term, such as an hourly or daily time frame, or over longer term weekly and monthly periods. More volatility in a market means more opportunity for a price to move dynamically and for a greater price range to be achieved.
There are two fundamentally different approaches for the determination of volatility. Those two forms of volatility are called historical and implied volatility. Implied volatility looks forward, Historical volatility looks at where it has been in the past.
Implied volatility is that level of volatility that will calculate a fair value equal to the existing option price. Implied volatility can be considered a "consensus" type of information as it measures how expensive an option is considered in the marketplace prior to expiration. If a market becomes more volatile, implied volatility is expected to rise. As the market becomes less volatile, its implied volatility is expected to drop.
You need to know, however, exactly how much the price has moved and over what period of time, for this information to be of more usual in your trading. A statistical measure of volatility is known as historical volatility. It can be also be referred to as statistical volatility.
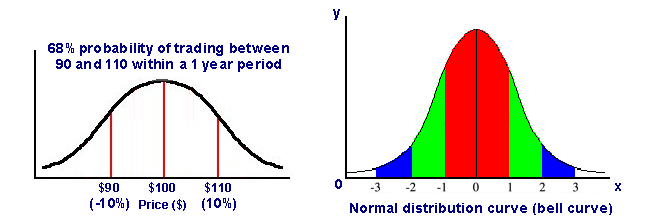
Historical Volatility (HstVo) most frequently refers to standard deviation of the change in the value of a market over a particular period of time. It can be expressed as an annual percentage. For example, if a stock or futures contract is trading at $100 and its historical volatility is 10%, if a normal distribution and volatility remain constant, by the end of that year that stock or futures contract should be trading between $90 to $110. (+ or - 10%) Historical Volatility (HstVo) is expressed as an annualized figure. 10% here means there is a 68% chance (1standard deviation) that the price will trade between $90 to $110 within a year.
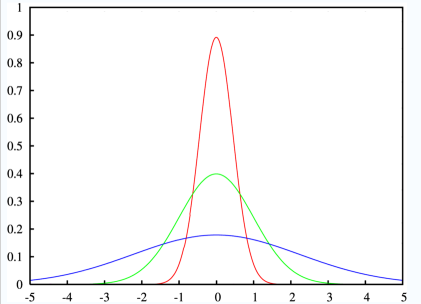
The standard deviation is a statistic that tells you how tightly the prices are clustered around the mean. When the prices are tightly clustered and the distribution curve is steep, the standard deviation is small. When the examples are spread apart and the distribution curve is relatively flat, that tells you that there is a relatively large standard deviation.
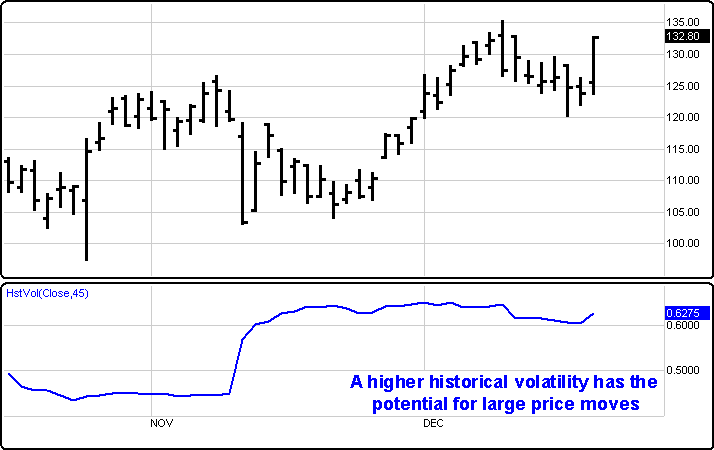
If you take the longer-term historical volatility reading and reduce it down to the current period, it gives you a good idea of where that stock or futures contract has the potential to trade. An investment with a high Historical Volatility has the potential for large price moves. A low Historical Volatility has statistically suggests there are limited potential for large moves.
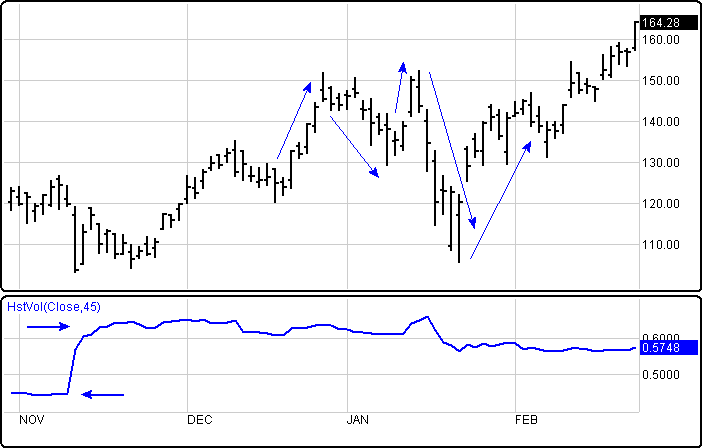
In this Potash Corp (POT) example below, we see a sudden strong increase in the Historical Volatility around November, 2007. Within a short time the stock began to oscillate in larger swing moves, going from $150 to $130, from $130 to $150, then back down from $150 to $110. It then began a stronger new uptrend that took out the $150 previous high. Prior to this time the moves in POT were less severe within the overall uptrend it was experiencing at that time.
Menu:
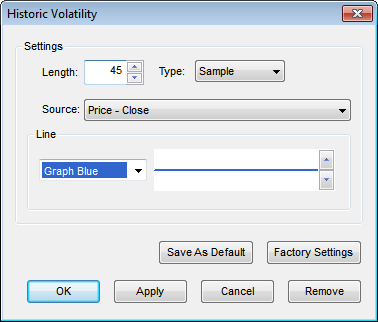
Settings
The Default Length is 45 (trading days). The Type can be selected from either Sample or Population. These values can be changed by clicking in their respective boxes and changing the values.
The Source can be set to one of the following options: Price - Open, Price - High, Price - Low, Price - Close, Price - Volume.
Line
The Color selection allows the user to change the color of the band & the Thickness selector allows the user to change the thickness of the band displayed.
To save your modified settings to be applied to future charts, click Save As Default. Once this is clicked at all times in the future the settings you have set will be applied to future charts when this study is added.
To return to the Factory Settings, click Factory Settings and then click Save As Default. Once this done at all times in the future the Factory Settings will be applied to future charts when this study is added.
Click "Ok" to apply the Historic Volatility to the selected chart or click "Cancel" or "Remove" to exit the study without applying it.
Click "Remove" to remove the study from the selected chart.