Definition: Moving Average Convergence Divergence (MACD) is a straightforward trend following or Momentum indicator developed by Gerald Appel. Momentum is the measurement of the speed or velocity of price changes or the rate of the rise or fall in prices. Changes in momentum are described as acceleration or deceleration in the price trend. The MACD tracks a simple relationship between two Moving Averages. It uses the convergence and divergence of those moving averages to identify easy-to-understand bullish or bearish setups. The MACD picks up on tendencies where momentum is beginning to increase or decrease and possibly transitioning into a new direction (usually in the early stages of a new trend or swing move). The MACD is usually most effective in markets with wide swings.
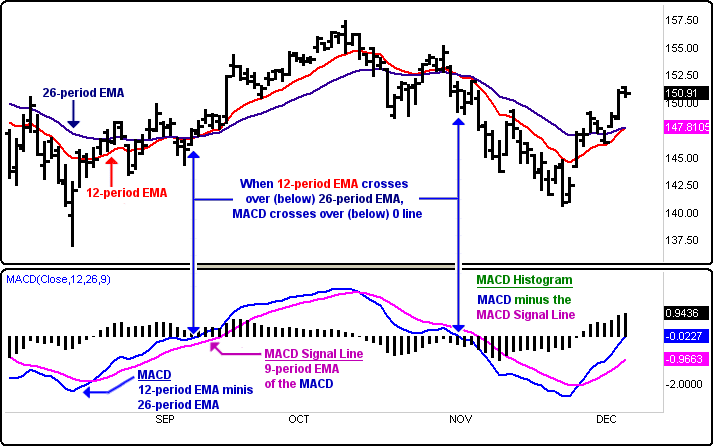
Moving Average Convergence Divergence (MACD) is the difference between the closing price of a fast (12-period) and slow (26-period) Exponential Moving Average (EMA).
In the MACD indicator, there are two lines. The first line is the MACD or the value difference between the fast and slow that the EMA plotted out. The second line is 9-period EMA of the MACD line plotted out. The difference of the 12 and 26-period EMA serves as the primary line in MACD. The 9-period EMA serves as a trailing secondary line. MACD can be plotted as two lines or as a histogram. The histogram crosses zero whenever the MACD crosses the 9-period line. The histogram will grow larger indicating that the speed between the two moving averages is accelerating and showing that there is greater strength or weakness in the trend.
A unique feature of the MACD indicator is it has no preset scaling boundaries. The MACD simply oscillates around 0 (zero) as a center or trigger line where the oscillation can take it as high or low as it wants. Extreme MACD oscillations are allowed because the MACD measures both price trend and momentum, so the greater the strength in a specific direction the greater the momentum trend swing. A MACD greater than 0 means the short-term average is higher than the long-term average. This indicates an upward trend.
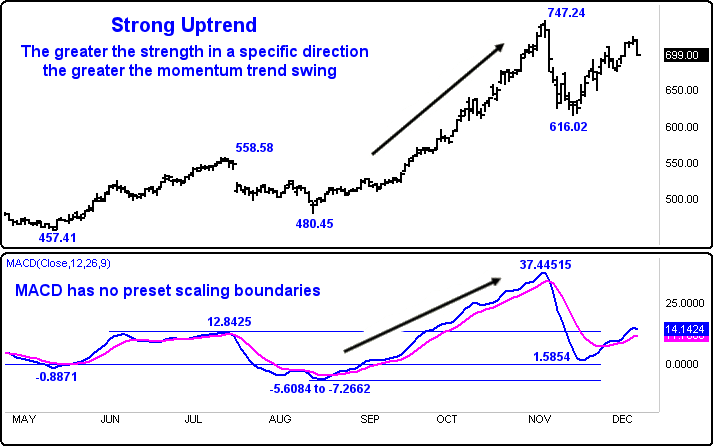
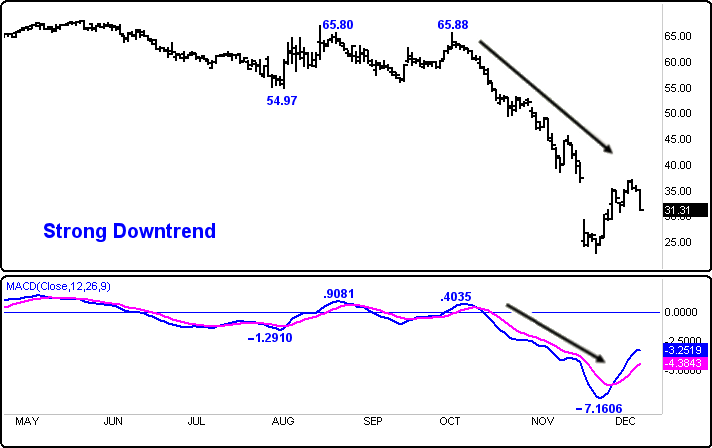
A MACD less than 0 suggests a downward trend. The steeper the slope of the MACD the stronger the momentum and greater price difference.
The three primary methods MACD is used with are crossover signals, oscillator divergence setups, and some overbought or oversold conditions.
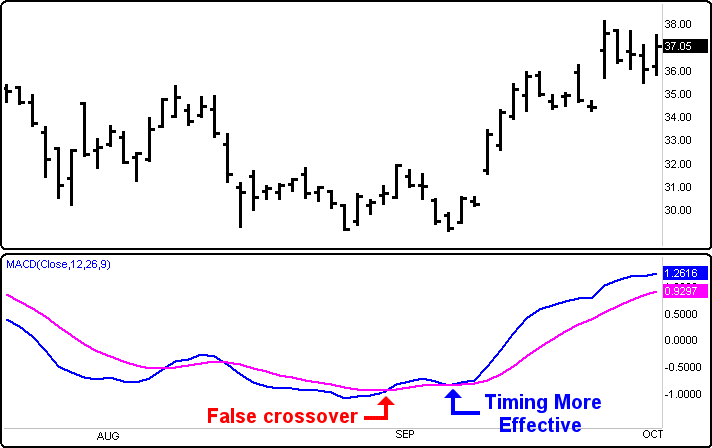
Moving Average Crossover - The simple way to use the MACD is to look for a crossover of the moving averages. When the MACD line crosses to the upside of the 9 EMA that is a bullish opportunity setting up. When the MACD line crosses to the downside of the 9 EMA that is a bearish opportunity setting up.
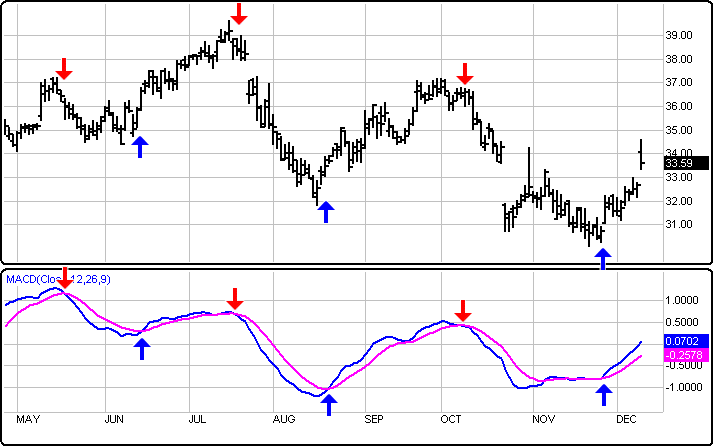
Another form of crossover is when the MACD histogram crosses under or over the zero line. When the MACD falls below the 9-period EMA line, it is a bearish signal. When the MACD rises above the 9-period EMA line the indicator gives a bullish signal.
The challenge with trading when the moving averages crossover is to try and avoid early false signals during congestion periods. The most effective signals usually occur when the lines begin to separate quickly after a crossover where the trend transition confirms itself more quickly.
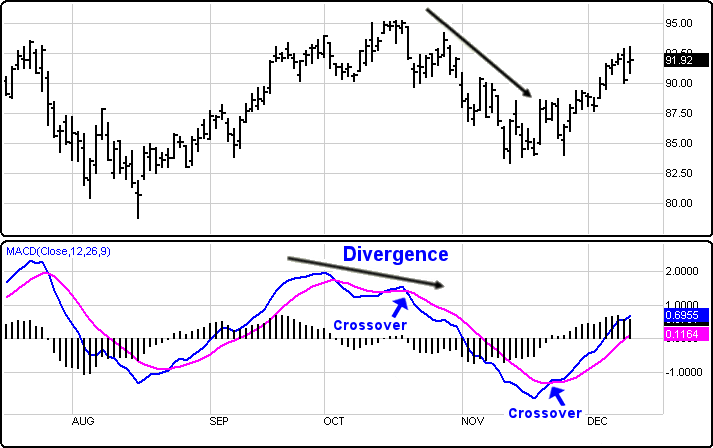
Oscillator Divergence - MACD divergence warns of a potential end of a trend or turn in prices. Divergence frequently precedes a turn. Divergence setups can be monitored for new transitions to trade in the opposite direction.
Overbought/Oversold conditions - When the shorter moving average begins to strongly pull away from the longer moving average and the MACD rises or falls, that move is generally signaling that it is overextending and will return to a more realistic level in the near-term. Overbought or oversold conditions do not often lead to major trend reversals, but they will often lead to, at the least, a temporary pullback before returning to the original trend. If it is not in a trend, by waiting for the overbought/oversold condition to deteriorate, the trend should return. Waiting for a pullback may signal a new entry.
One of the benefits of the MACD as a trend following indicator is that it will not be wrong for long. The MACD follows the market as long as trends are gaining momentum. Because it is an EMA some of the lag factor traditionally associated with moving averages is reduced. As a momentum indicator when we see the oscillator divergence we know the trend strength is waning and may be near a potential top or bottom.
One of the weaknesses of the MACD is that sometimes, it is harder to identify what kind of overbought or oversold condition is setting up, a temporary corrective phase reversal or a major top or bottom setup.
The MACD has been around a long time. It has been tested over time and continues to be popular because of its simplicity and ease of use.
Menu:
 Moving Averages
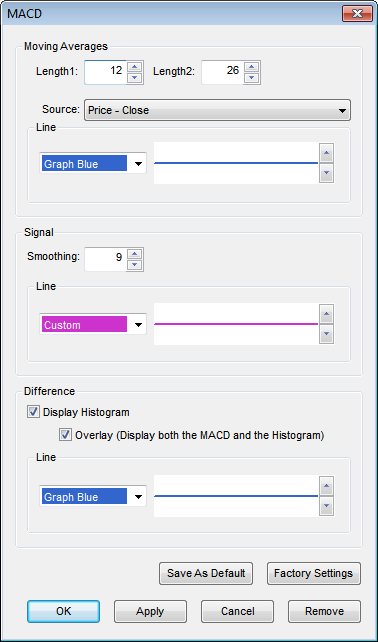
The Default Length1 is 13 (trading days) and the default Length2 is 26. These values can be changed by clicking in their respective boxes and changing the values.
The Source can be set to one of the following options: Price - Open, Price - High, Price - Low, Price - Close, Price - Volume.
Line
The Color selection allows the user to change the color of the band & the Thickness selector allows the user to change the thickness of the band displayed.
Signal
The Default Smoothing Value is set at 9. This value can be changed by clicking in the respective box and changing the value.
Line
The Color selection allows the user to change the color of the band & the Thickness selector allows the user to change the thickness of the band displayed.
Difference
If the Display histogram Checkbox is unselected then the Histogram will be removed from the MACD Study.
If the Overlay Checkbox is unselected then the Moving Average and Signal bands will be removed from the MACD Study.
Line
The Color selection allows the user to change the color of the Histogram & the Thickness selector allows the user to change the thickness of the histogram bands displayed.
Zero Line
The Color selection allows the user to change the color of the zero line.
To save your modified settings to be applied to future charts, click Save As Default. Once this is clicked at all times in the future the settings you have set will be applied to future charts when this study is added.
To return to the Factory Settings, click Factory Settings and then click Save As Default. Once this done at all times in the future the Factory Settings will be applied to future charts when this study is added.
Click "Ok" to apply the study to the selected chart or click "Cancel" or "Remove" to exit the study without applying it.
Click "Remove" to remove the study from the selected chart.