The Money Flow Index is a volume/momentum technical indicator that measures the strength of total money flowing into and out of a stock, index or futures contract. Money Flow looks at both price and volume activity. It is similar to RSI, which looks only at price.
Money Flow (MFI) is a theory that correlates a relationship between price movement and the actual amount of money flowing in or out of a stock, index or futures contract. The belief is as money goes in or out of a security a measurable, predictive and usable pattern should exist. By measuring the amount of net money movement, supply and demand trends can be qualified, and better identified as attractive or overpriced. You are, in essence, measuring whether investors are paying more or less than market price.
Money Flow analysis identifies divergences between trends in price and trends in money flow. If the price goes up, money should be flowing into it. If the price goes down, money should be flowing out. When price is trending higher, money flow should be trending higher. When price is trending down, money flow should be trending down. Bearish divergence is when price is trending higher and money flow is falling. Bullish divergence is when price is trending lower and money flow is increasing. Price usually corrects in the direction of money flow.
Money Flow for a specific period is calculated by multiplying the average price by the volume. Positive Money Flow is the sum of the positive Money Flow over a specific period. Negative Money Flow is the sum of the negative Money Flow over a specific period. Money Flow is considered positive when there is an increase in average price and negative when there is a decrease in average price. The Money Flow Ratio is the positive Money Flow divided by the negative Money Flow. A Money Flow Index generally looks like the following formula: Money Flow Index = 100 - (100/ 1 + Money Ratio.)
Money Flow is about comparing price movement with trading volume on up days versus down days. The Money Flow indicator rises if there is more volume on up days than on down days, and vice versa. Money Flow should not be the primary indicator for trading; it functions best as a supporting study to help further confirm a trading opportunity.
When using the Money Flow Index (MFI) monitoring for divergence between the indicator and the price action is the key. If the price trends higher and the MFI trends lower (or vice versa) a price reversal may be imminent. The divergence between the indicator and the price usually signals that a reversal of the price trend is expected.
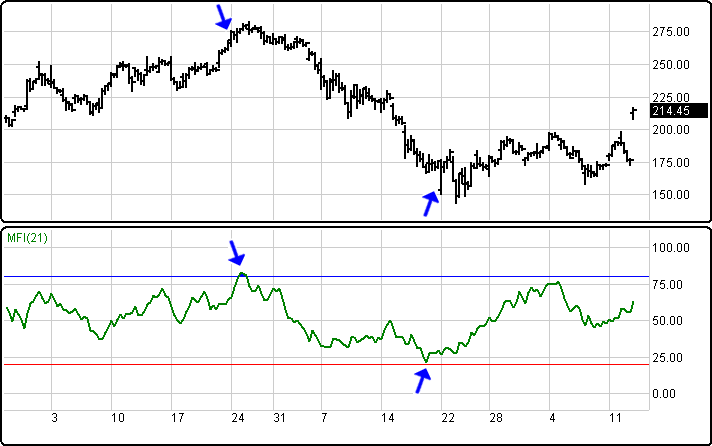
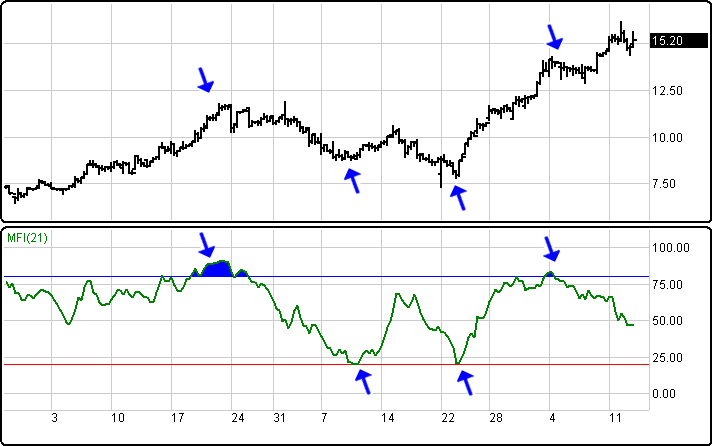
Money Flow Index above 80 usually shows that the security is overbought and the price is likely to fall down. Monitor for tops to occur when the MFI is above 80.
Money Flow Index below 20 usually shows that the security is oversold and a reverse trend may be expected with the price setting up to rally. Monitor for market bottoms to occur when the MFI is below 20.
General patterns to observe when divergence begins to appear are to buy on weakness when money is flowing into a stock, index or futures contract even though its price has been falling. This could be an opportunity to buy before it is likely to rise. Equally, when divergence appears, sell on strength when money is flowing out of a stock, bond or commodity even though its price has been rising. This could be an opportunity to sell.
Menu:
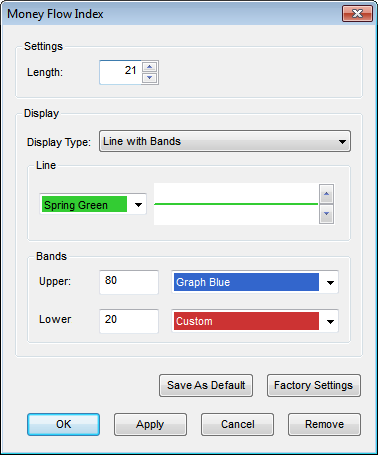
Settings
The Default Length is 21 (trading days). This value can be changed by clicking in the respective box and changing the value.
Display
The Display Type can be set to one of the following options: Line, Line with Bands, Line with Bands and Shading, Line with Shading.
Line
The Color selection allows the user to change the color of the band & the Thickness selector allows the user to change the thickness of the band displayed.
Bands
The default Upper Band is set at 80 while the Lower band is set at 20. These values can be changed by clicking in their respective boxes and changing the values. The Color selection allows the user to change the color of the band displayed.
To save your modified settings to be applied to future charts, click Save As Default. Once this is clicked at all times in the future the settings you have set will be applied to future charts when this study is added.
To return to the Factory Settings, click Factory Settings and then click Save As Default. Once this done at all times in the future the Factory Settings will be applied to future charts when this study is added.
Click Ok to apply the Money Flow Index to the selected chart or click Cancel or Remove to exit the study without applying it.
Click Remove to remove the study from the selected chart.