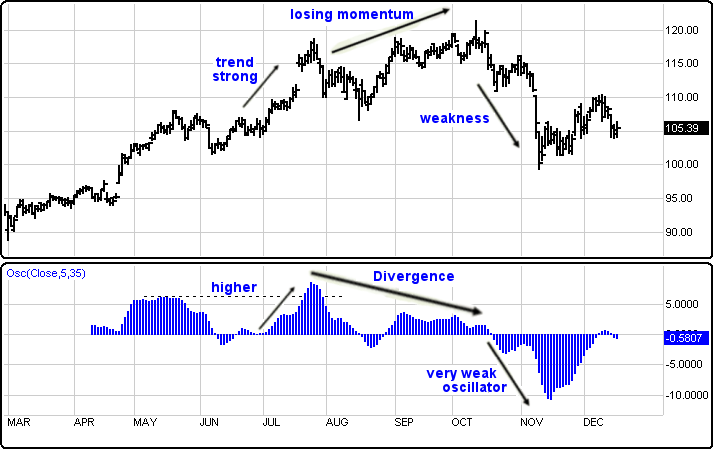
Price Oscillator (OSC) is a very simple calculation that tracks the difference between two simple moving averages and plots it out as a histogram moving above and below a zero line. The primary strength of this simple indicator is can show when a trend is strengthening or when it is losing momentum.
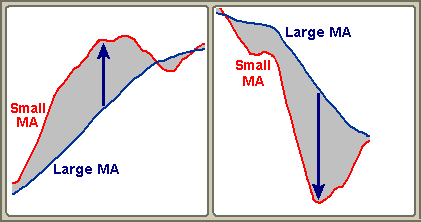
The difference between a small moving average and a larger moving average is like the difference between watching a fast sports car take off and drive away from a slow 4 cylinder pickup truck. The rate of acceleration for one may be greater than the other. The further the difference between the moving averages the greater the momentum building.
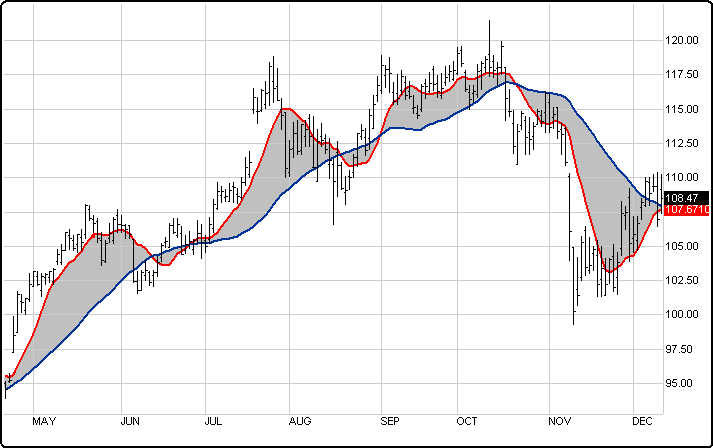
Below is a sample where we use a 5-period (small) moving average to represent the current price action, while we use a 35-period (larger) moving average to represent the overall price action. When the price move begins to accelerate the difference between the smaller 5-period moving average and the larger 35-period moving average begins to grow. The larger the width, the greater the odds a more sustainable trend is in progress and we have improved odds we are trading in the correct direction.
When divergence appears between oscillations, a loss in momentum is usually indicated. That trend is not as strong as it once was, so could be building an end of the trend. Moving average crossovers in the Price Oscillator are identified with crossings of the zero line.
Some refer to the Price Oscillator is the "Elliott Wave" oscillator developed in the 1980's by Tom Joseph. This popular oscillator setting used a histogram of the 5-period and 35-period moving average, where rules are used in conjunction with Elliott Wave theory to trade markets. Essentially what this technique tries to measure is the rate of price change in one Elliott wave against the rate of change in another wave.
If you want a more sensitive Price Oscillator that crosses the zero line quicker, try using something like a 5-period and 17-period combination. Oscillations are quicker the closer the moving average numbers used for a calculation. If you want something where the moving averages do not cross zero as quickly, something like a 10-period and 70-period moving average combination works best.
The most important Price Oscillator concepts are:
* The greatest high or low value in a positive or negative oscillation identifies a potential bullish/bearish wave 3.
* Wave 4 almost always pulls back to within 90% or crosses zero in the opposite direction of the main trend.
* Wave 5 usually makes a new high or low price for the bigger trend in progress, but often diverges from the Elliott Oscillator; if
Wave 5 makes a new high/low price, but doesn't diverge from the indicator, alternate analysis may conclude that the wave was not wave 5, but instead a wave 3 extended itself.
Menu:
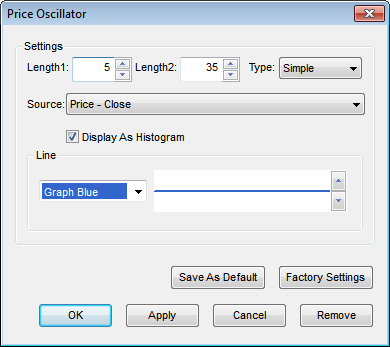
Settings
The Default Length1 is 5 (trading days) and the default Length2 is 35. The Type can be selected from either Simple, Exponential, or Weighted. These values can be changed by clicking in their respective boxes and changing the values.
The Source can be set to one of the following options: Price - Open, Price - High, Price - Low, Price - Close, Price - Volume.
Line
The Color selection allows the user to change the color of the band & the Thickness selector allows the user to change the thickness of the band displayed.
To save your modified settings to be applied to future charts, click Save As Default. Once this is clicked at all times in the future the settings you have set will be applied to future charts when this study is added.
To return to the Factory Settings, click Factory Settings and then click Save As Default. Once this done at all times in the future the Factory Settings will be applied to future charts when this study is added.
Click Ok to apply the Price Oscillator to the selected chart or click Cancel or Remove to exit the study without applying it.
Click Remove to remove the study from the selected chart.