Definition: Stochastic is a technical analysis momentum indicator developed in the late 1950s by George C. Lane. A Stochastic measures the relationship between a closing price and its price range (the difference between the high and the low) over a set period of time. The oscillator’s primary purpose is to identify when a market has moved to extreme ranges within this set period of time. The logic states that when prices are near the high range, it indicates buying (accumulation) has now pushed to an extreme. This is called an overbought condition.
There are different kinds of Stochastic algorithms, but the preferred or traditional Stochastics are referred to as the Normal and Slow Stochastic. The Slow Stochastic is the same as the normal but it adds a smoothing calculation using a moving average technique.
When prices approach the bottom range, it indicates that selling (distribution) has now pushed to an extreme. This is called an oversold condition. The Stochastic study is an oscillator designed to indicate oversold and overbought market conditions. Overbought and oversold conditions serve as early warning signs of a trend reversal. The Stochastic oscillator maintains popularity over the decades because of its ease-of-use and effectiveness as an algorithm. To this day, it remains a primary technical tool for many traders.
There are different kinds of Stochastic algorithms, but the preferred or traditional Stochastics are referred to as the Normal Stochastic and the Slow Stochastic. The Slow Stochastic is same as the Normal with a smoothing function using a moving average.
Both Normal and Slow Stochastic calculations generate two lines: %K and %D; both have overbought and oversold zones. Many technical analysis programs default Stochastics overbought and oversold zones to 75 and 25, yet many traders prefer using 80 for overbought and 20 for oversold zone.
The oscillator's sensitivity to market movements can be reduced by adjusting the time period or by taking a moving average of the result. This indicator is calculated with the following formula:
%K = 100[(C - L14)/(H14 - L14)]
C = the most recent closing price
L14 = the low of the 14 previous trading sessions
H14 = the highest price traded during the same 14-day period
%D = 3-period moving average of %K
How To Use:
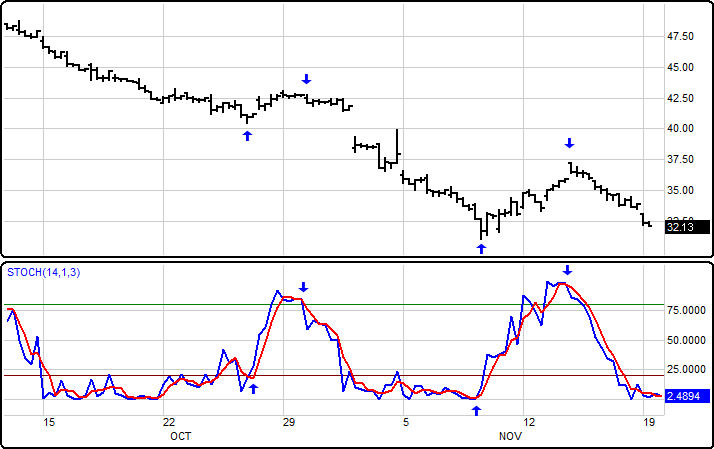
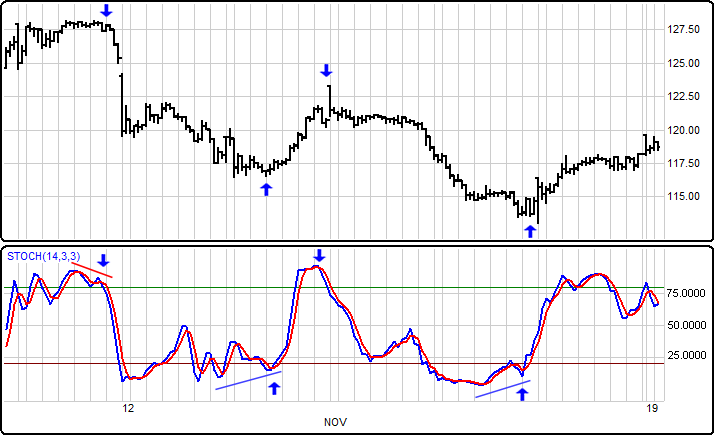
Lane contends that the most important signal is divergence between %D and the market being traded. He explains divergence as the process where the stochastic %D line makes a series of lower highs while the commodity makes a series of higher highs. This indicates an overbought market. An oversold market exhibits a series of lower lows while the %D makes a series of higher lows.
The theory behind this indicator is that in an upward-trending market, prices tend to close near their high, and during a downward-trending market, prices tend to close near their low.
When one of the above patterns appears, traders anticipate a market signal. Transition signals occur when the %K crosses through a three-period moving average called the %D. In general, market positions can be initiated when the %K crosses the %D from the right-hand side. A right-hand crossover occurs when the %D has bottomed or topped and is moving higher or lower, and the %K crosses the %D line. The most reliable trades, according to Lane, occur with divergence and when the %D is between 10 and 15 for a buy signal and between 85 and 90 for a sell signal.
The Stochastics oscillator works best in a trading market range.
Menu:
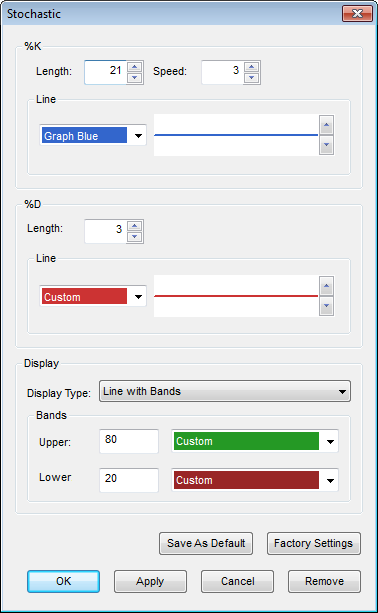 %K
%K
The Default Length is 14 (trading days) and the default Speed is 1. These values can be changed by clicking in their respective boxes and changing the values.
Line
The Color selection allows the user to change the color of the band & the Thickness selector allows the user to change the thickness of the band displayed.
%D
The Default Length is 3 (trading days). This value can be changed by clicking in the respective box and changing the value.
Line
The Color selection allows the user to change the color of the band & the Thickness selector allows the user to change the thickness of the band displayed.
Display
The Display Type can be set to one of the following options: Line, Line with Bands, Line with Bands and Shading, Line with Shading.
Bands
The default Upper Band is set at 80 while the Lower band is set at 20. These values can be changed by clicking in their respective boxes and changing the values. The Color selection allows the user to change the color of the band displayed.
To save your modified settings to be applied to future charts, click Save As Default. Once this is clicked at all times in the future the settings you have set will be applied to future charts when this study is added.
To return to the Factory Settings, click Factory Settings and then click Save As Default. Once this done at all times in the future the Factory Settings will be applied to future charts when this study is added.
Click Ok to apply the Stochastic to the selected chart or click Cancel or Remove to exit the study without applying it.
Click Remove to remove the study from the selected chart.