Position Input and Summary
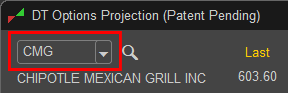
The trader begins the process of using the projection tool by entering in the stock symbol in the Symbol Field in the upper left hand corner of the Projection Window.
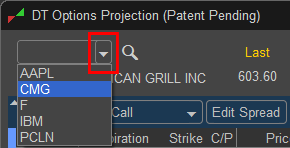
A history of symbols can be accessed by left clicking on the drop down menu to the right of the symbol field.
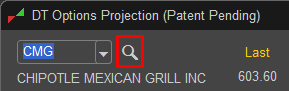
If you do not know the symbol the lookup window can be accessed by left clicking on the magnifying glass and using the Symbol Search Feature.
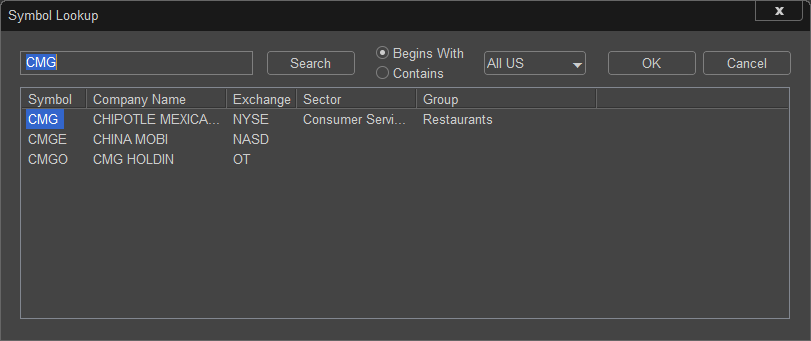
In this example the symbol CMG is entered and all stocks with CMG in the Symbol are located. Since we are looking for Chipotle highlight the correct symbol and click OK.
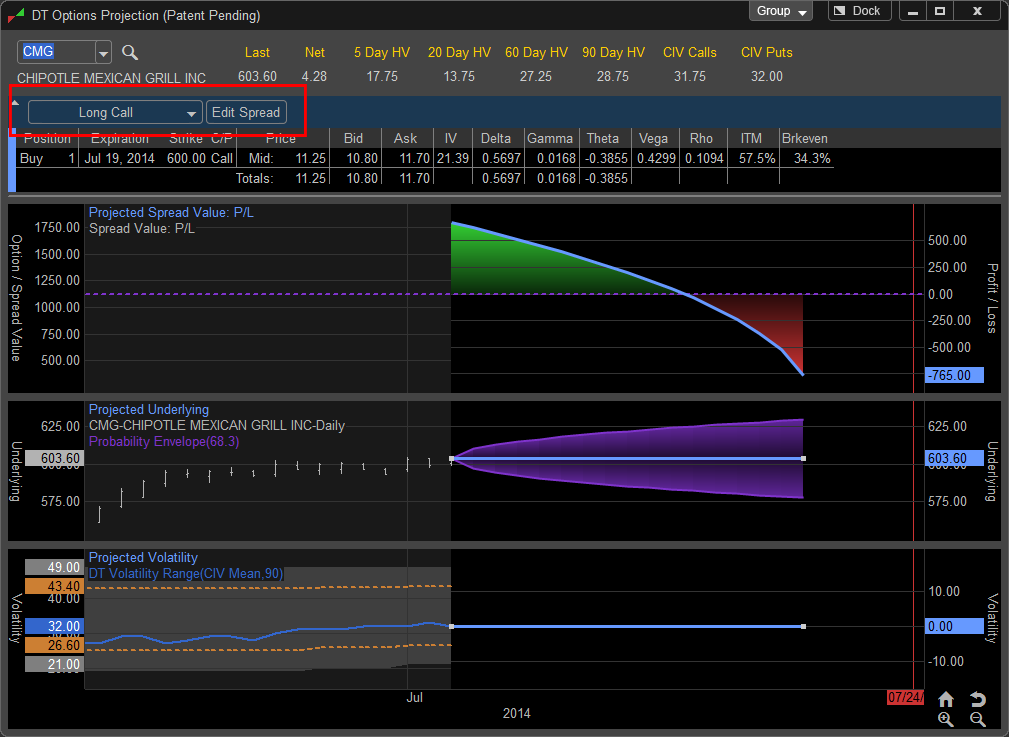
Once the symbol is chosen the trader the DT Options Projection Tool will load with a default position of a Long Call showing an At the Money option with the next monthly expiration. To change the options contract to another strike or expiration you can left click on the "Edit Spread" button to access the pre-loaded option contract.
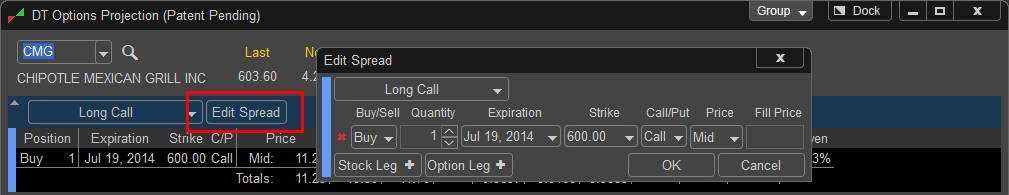
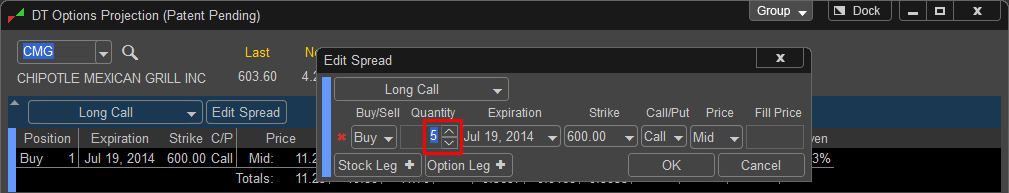
Left clicking "Edit Spread" will allow you to access and change the options contracts displayed in the DT Options Projection Tool
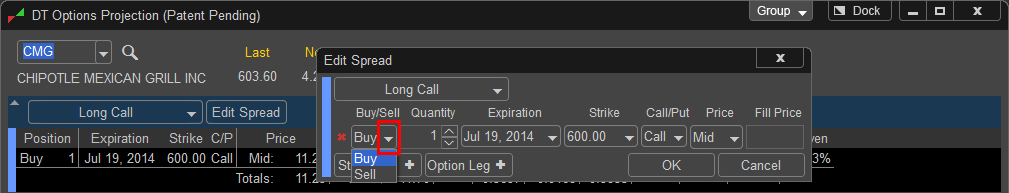
The position direction can be adjusted by left clicking on the Buy or Sell drop down menu and choosing the desired side. In this case since we are using the prebuilt template the position sides are automatically chosen.
In addition the trade size can be adjusted by manually entering in a new quantity or left clicking on the up and down arrows to the left of the quantity field.
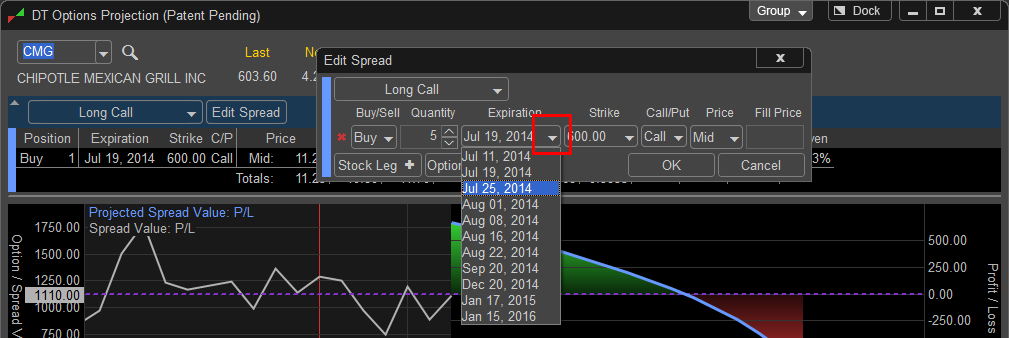
If the trader wishes to choose a different expiration month the drop down menu will display all available option expirations. By changing the first expiration in a multi leg spread the software will automatically adjust all legs to the new expiration.
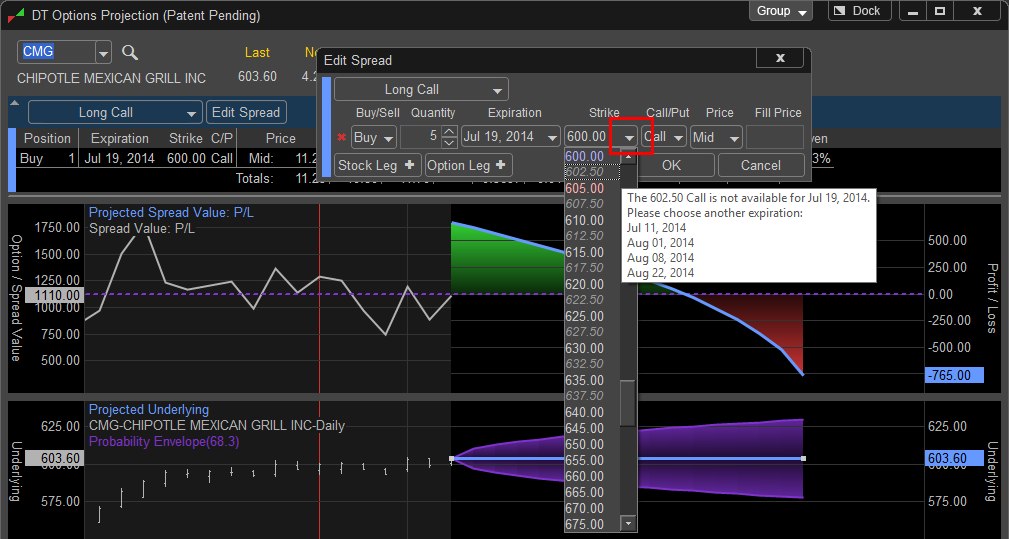
To change the default strike price the user can left click on the drop down menus under the Strike column. Available strikes for the chosen expiration are showed in bold type. Strikes that are unavailable for the chosen expiration are greyed out. When a strike price that is not available for the chosen expiration is chosen the software will display a message alerting the user which expirations are available for the chosen strike price.
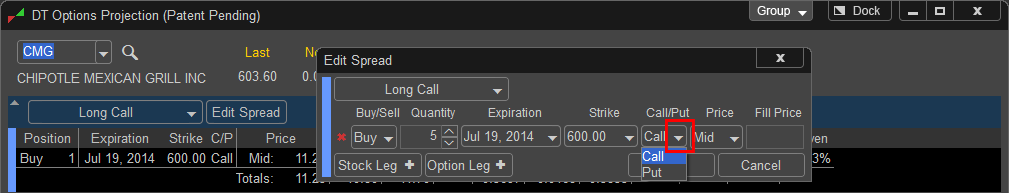
When using a pre-built template the software automatically selects which legs of the trade should be calls or puts. If the trader builds a spread manually or prefers to adjust the prebuilt spread to another spread type the C/P column allows the changing of the legs to Calls or Puts.
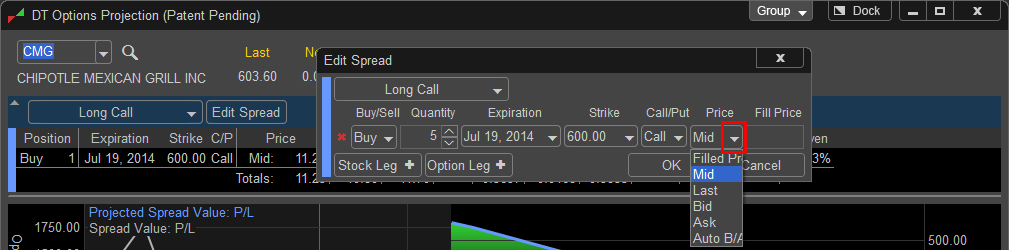
The Projection tool chooses the midpoint between the bid and ask for the default price to calculate the position changes from. In addition, the trader can choose to build the trade either on the Bid, Ask,
Last, Auto B/A, r a custom price which is identified by choosing Filled.
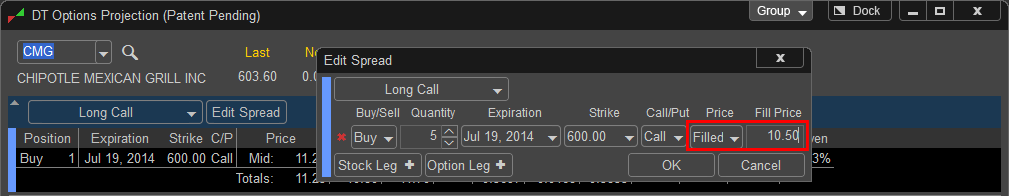
The user can also manually enter in a price based on a position they already own by typing in a price in the Price column, once a new price is entered the projection tool will change the drop down to Filled to simulate the price the trader bought or sold the underlying position at.
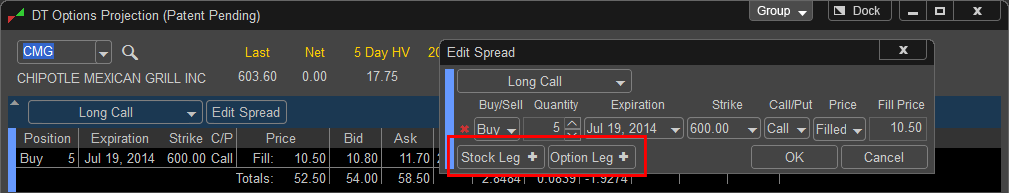
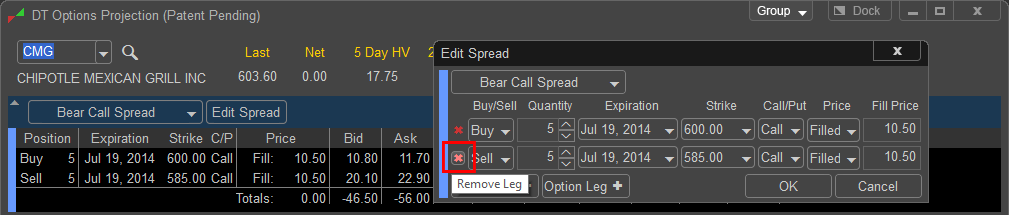
To add an additional Option or Stock Leg to the position click the + next to Stock Leg or Option Leg and choose the desired Quantity and Option contract for Option Legs. If the changes made match once of the prebuilt Spread Templates the DT Projection Tool will identify the spread in the Spread Template drop down menu.
In this case the added option leg has made this position into a Bear Call Spread.
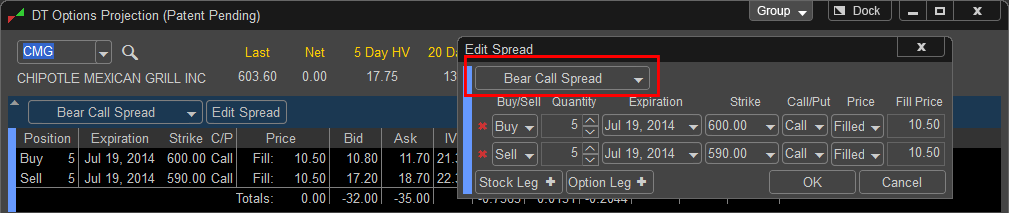
To remove an option or stock leg, left click on the red "X" to the left of the leg you wish to delete from the Projection.
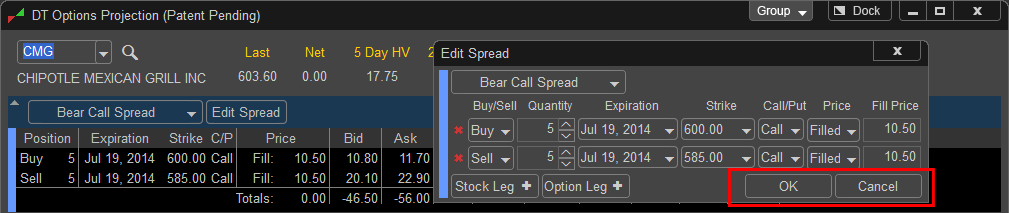
Once any changes to the legs are made the user selects OK to apply the changes or Cancel to erase them.
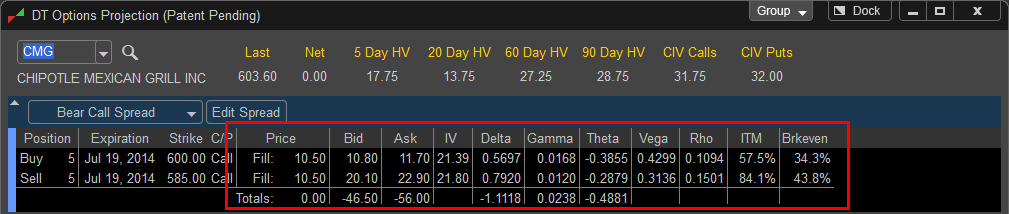
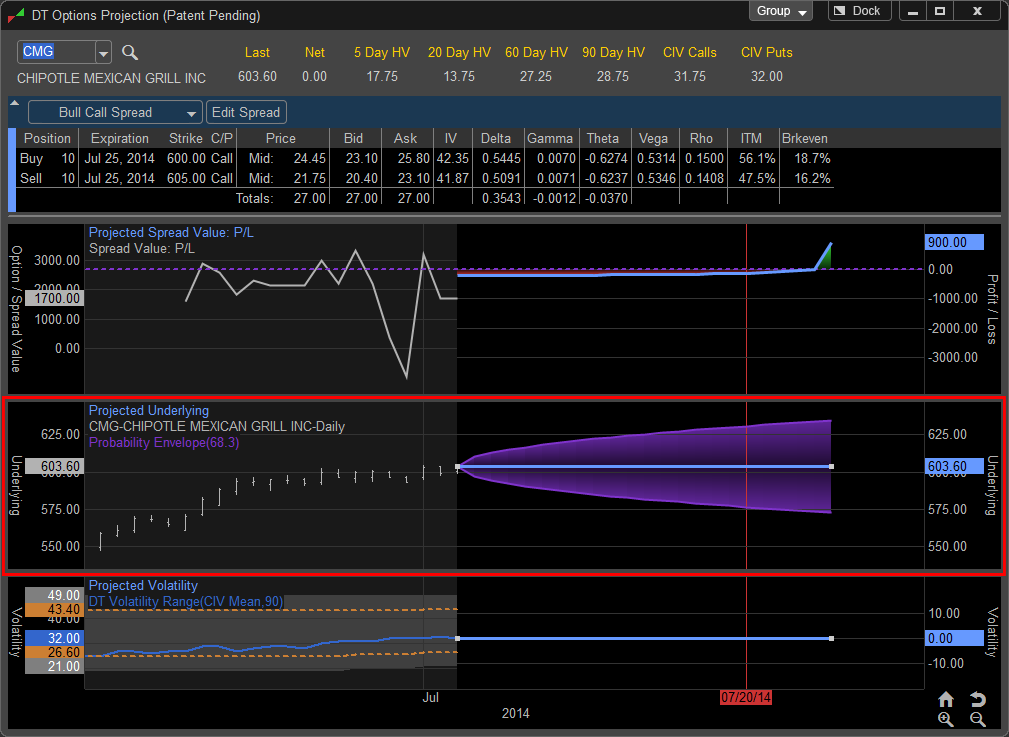
Once the Option position is selected the DT Options Projection Tool displays the current Spread Costs and Net Values for Delta and Gamma.
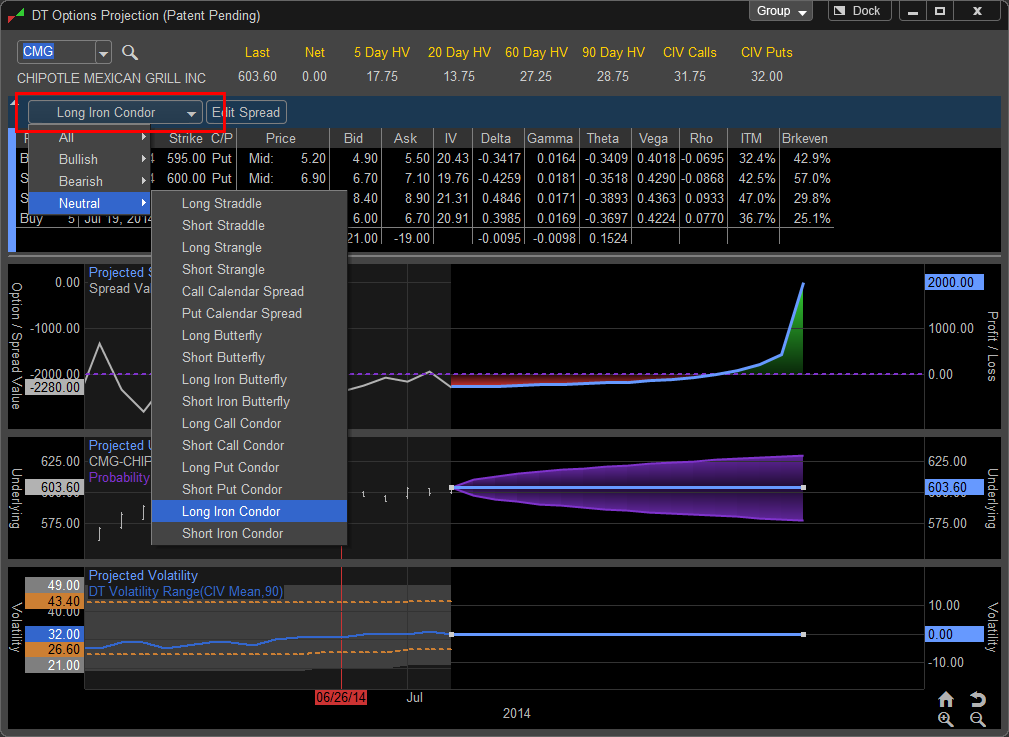
In addition, to change the position to another pre-build position or spread you can left click on the Spread Menu where the default "Long Call" is displayed. In this example we will choose "Long Iron Condor" once selected the DT Options Projection Tool will automatically build a Long Iron Condor on the selected symbol. To edit the option legs chosen simply click on the "Edit Spread" button and make the changes as described previously. Spreads are organized by market sentiment; Bullish, Bearish, Neutral or a choice to display all.
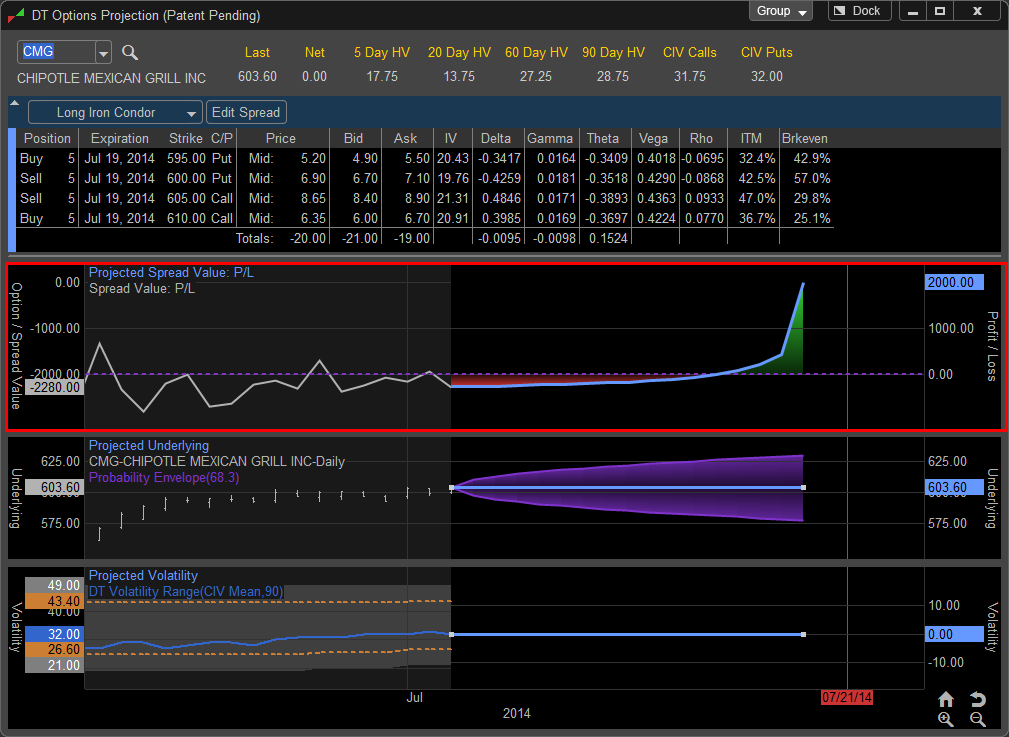
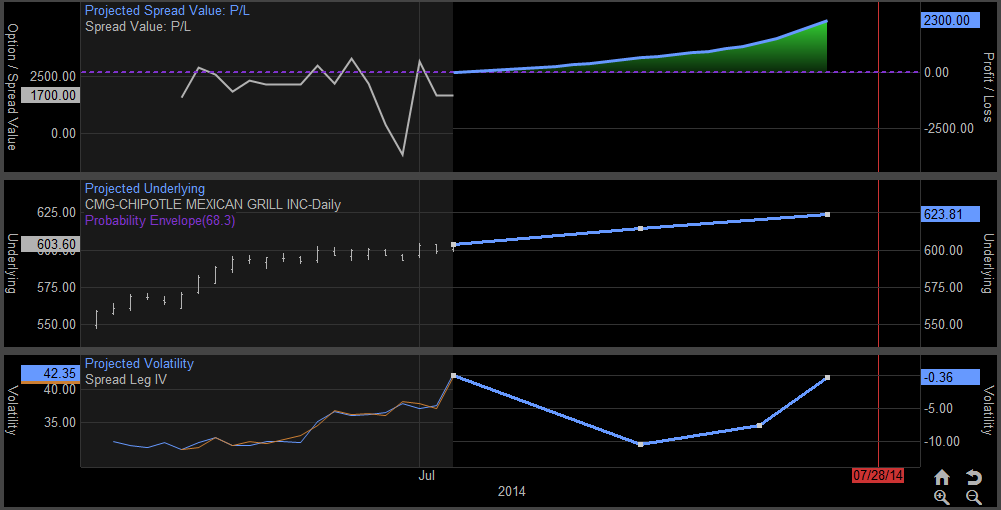
Projected Spread Value
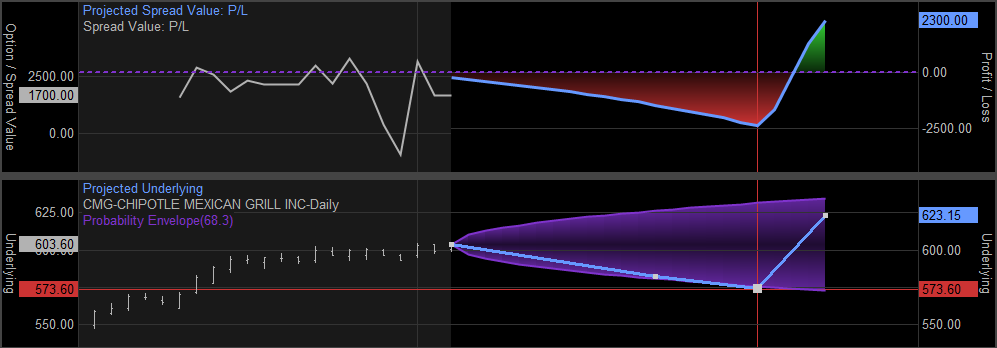
The first Projected Spread Value Pane shows the profit and loss for position until expiration based on the changes in the underlying. As you move the cursor the projected profit or loss of the trade lines up with the changes in the underlying in the Projected Underlying pane as well as the changes to volatility simulated in the Projected Volatility pane. If the position is profitable the area is shaded green if it’s losing the area will be shaded red, the dollar amount of the gain or loss is displayed in the axis to the right of the pane.
The pane is split into two sections, on the left is the profit and loss history which is based on the underlying’s history of price and volatility. The right side of the pane is the projected area where the profit and loss are projected to be based on the user selected changes to price and volatility.
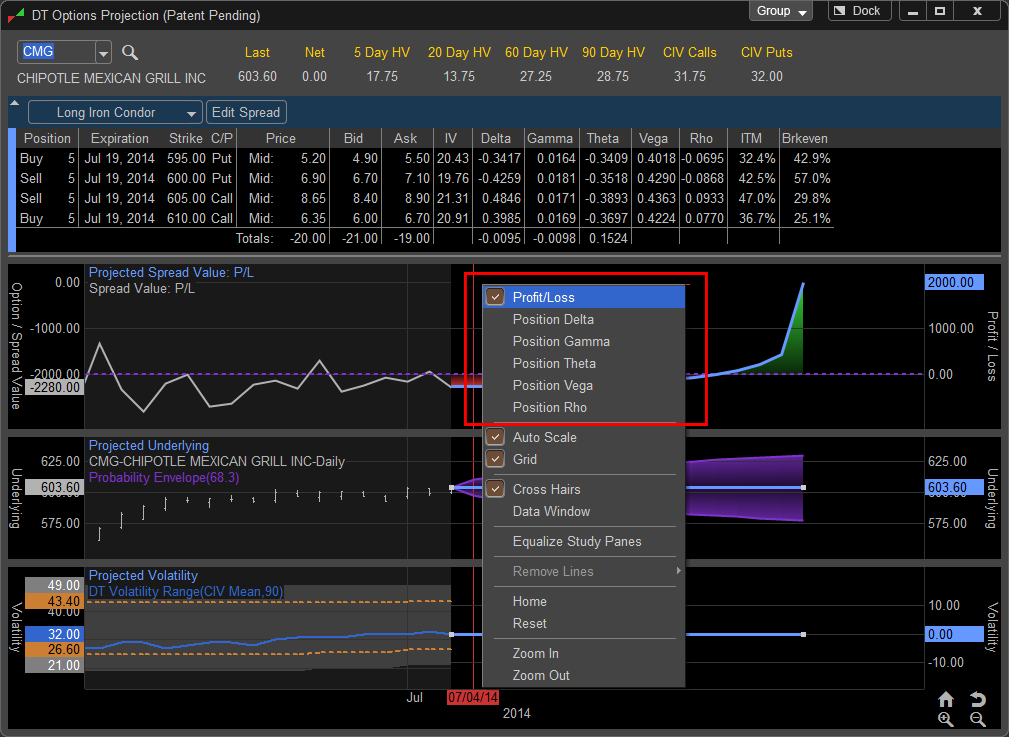
In addition to profit and loss the trader can choose to display the projected changes in Greek values on the option trade by right clicking in the Option / Spread Value ane and choosing the desired Greek Value to display. The Projection Tool can display Delta, Gamma, Theta, Vega, and Rho by selecting them in the right click menu.
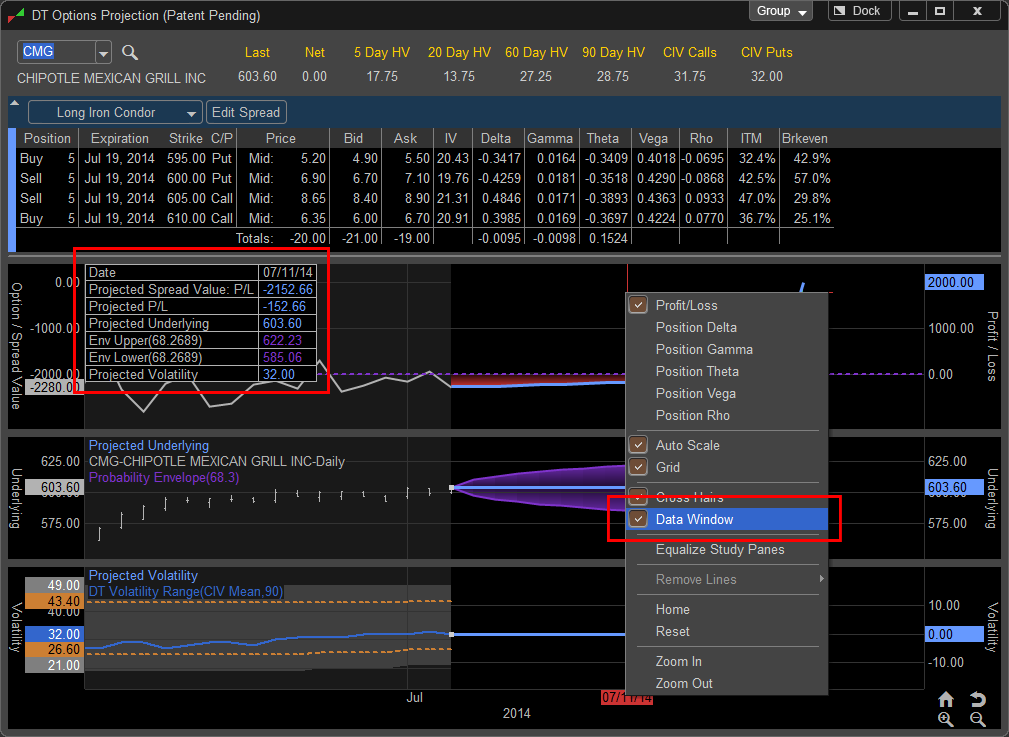
A Data Window can be added to the pane from the right click menu to see the numeric value of changes made to the lower panes as well as a snapshot of current profit and loss or selected Greek value as the changes in underlying price and volatility are made.
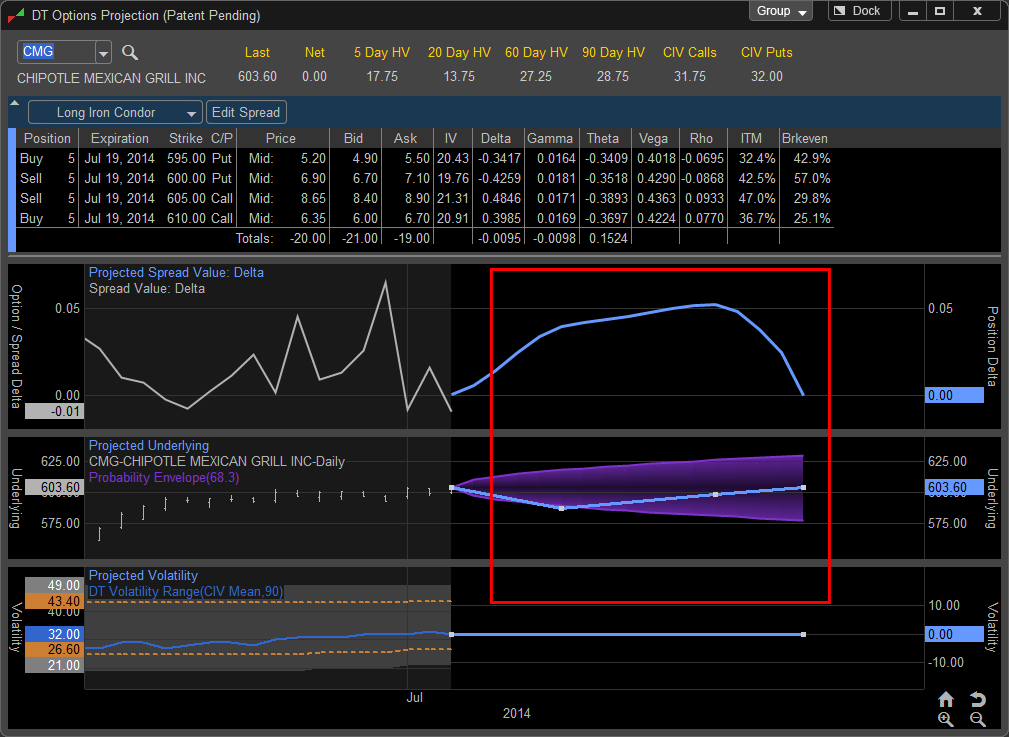
In this example The Projected Spread Value has been changed to display Delta. As changes to the underlying price and volatility occur the projection tool will display the positions changing Delta values here we see how a drop in the price of the underlying will effect the overall positions Delta. In addition to Delta the Projection Tool can also display Gamma, Theta, Vega, and Rho by selecting the from the right click menu.
Projected Underlying Pane
The Projected Underlying pane displays a price chart showing a history of the underlying symbol of the options position. The left hand shaded area is the historical price and the darker right side of the pane is the area where future price and time can be adjusted based on the traders predictions. The prediction area of the pane has a solid line representing the price and date of the options position until the expiration. The purple cone is a probability cone representing a one standard deviation price move based on the underlying’s 45 day historical volatility; this helps the trader keep their price projections in a realistic range.
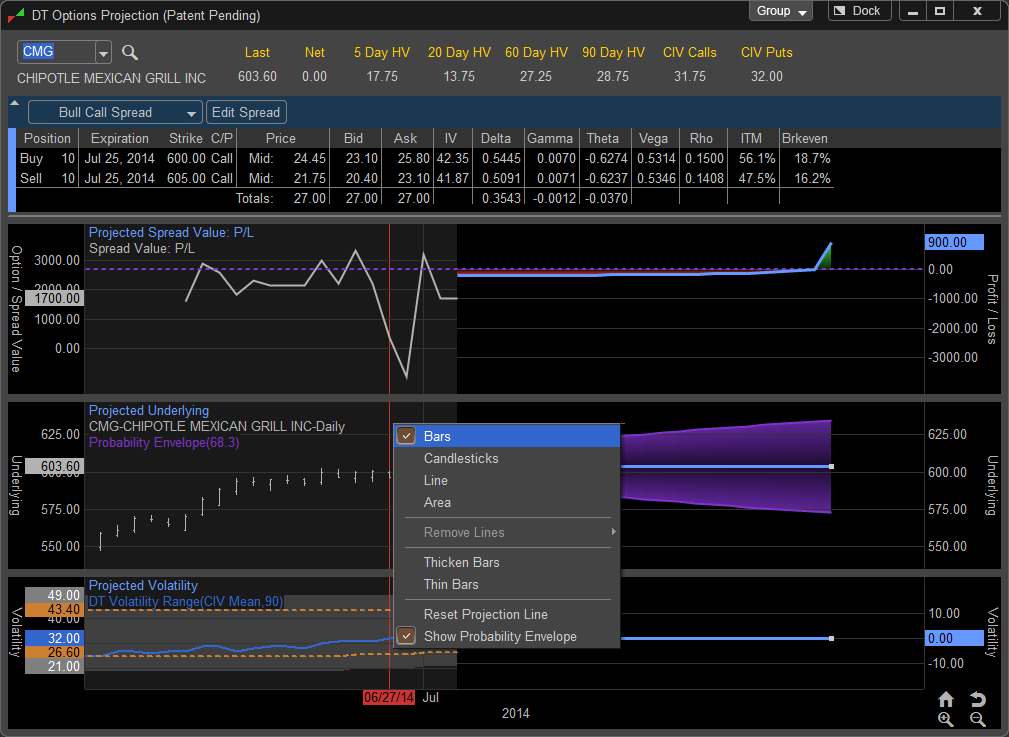
The various chart display options for the Projected Underlying pane can be accessed by moving the cursor into the pane and right clicking. Here the pane can be set to display the chart in Bars, Candlesticks, Line, or Area based charts.
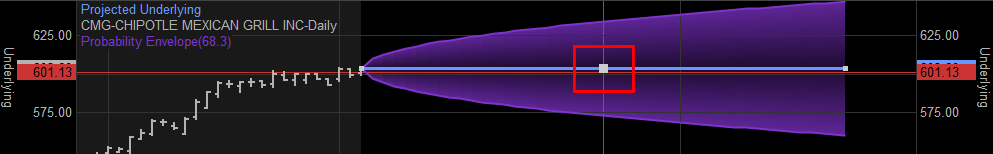
To predict a price movement in the future the user moves the cursor to the selected date with the vertical cursor as the cursor is being moved a square appears on the projection line. Once the correct date is aligned on the cursor hold the left mouse button down and move the projection line to the predicted price.
In this example a move to the chosen price level will put the position in a loss. As the price increases towards expiration the position will move back into profits as indicated in the first pane.
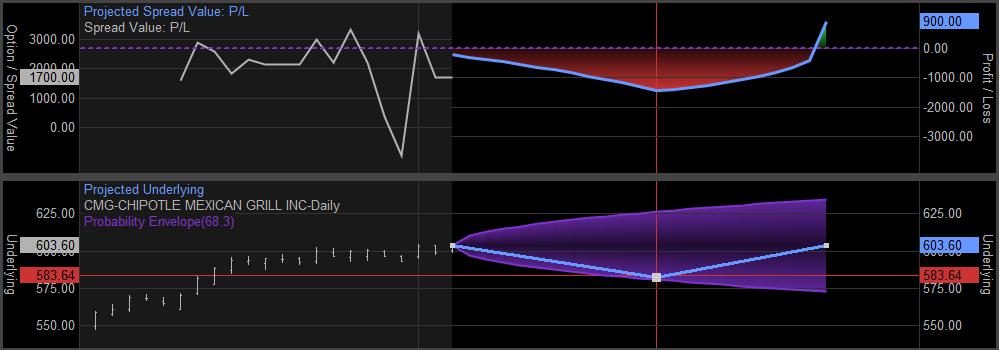
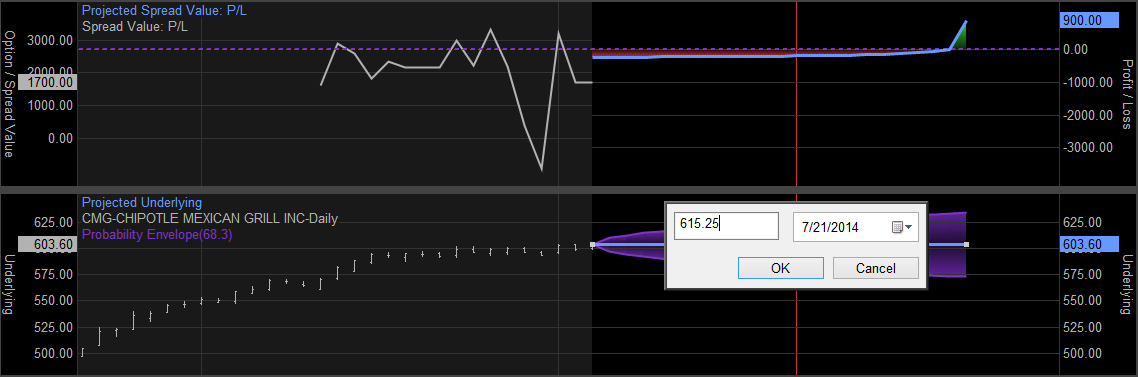
Multiple price projections can be made by lining up the vertical cross hair to the next date you wish to adjust price for. In this example we have moved the price on 07/2114 to a lower value. As a result of this move the position is showing a greater loss on that date. As the price moves higher towards the expiration you will see the position returns to profits as illustrated in the first pane.
In addition to dragging the price to a new level by left clicking you can also simply double clicking anywhere on the projection line to access the manual entry menu. Here you can enter in an exact price and you anticipate the market moving to.
You can also choose a specific date by left clicking on the date drop down menu. This will open up a calendar and you can select the date for your price projection by left clicking on the calendar date. To select a different month the user left clicks on the forward and backward arrows adjacent to the month and year at the top of the calendar.
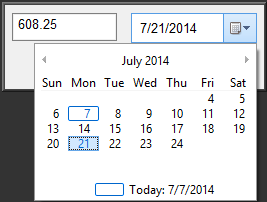
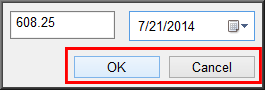
In this case the user has selected a price of 615.25 on July 21, 2014. Once the date is selected clicking OK will place the projection, Cancel will delete the changes.
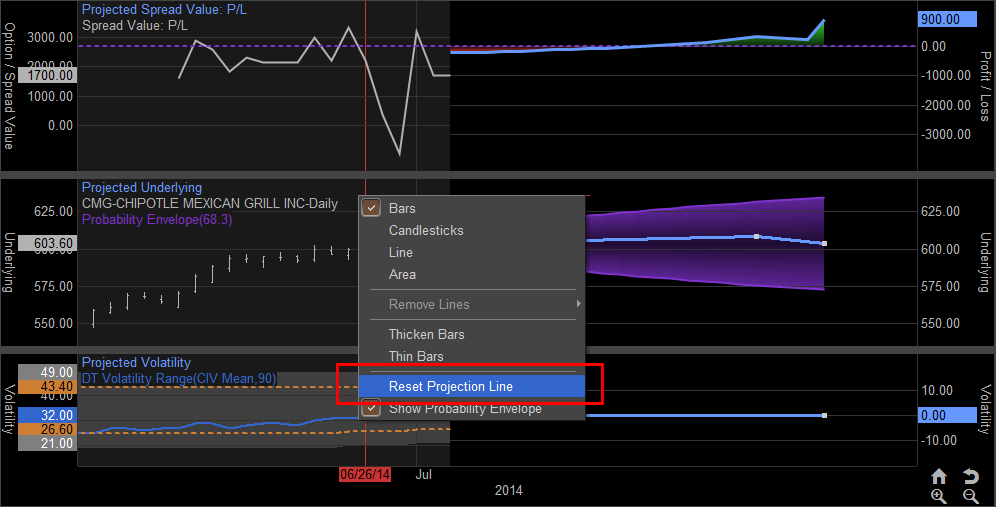
To reset the changes made to the prediction line the user can right click in the Projected Underlying tab and choose Reset Projection Line; this will return the line back to a default flat line.
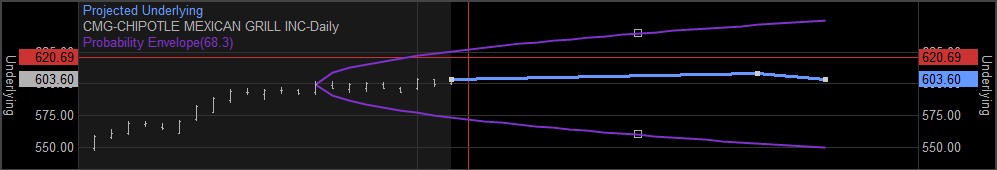
The Probability Envelope can be adjusted to a previous date by moving the cursor over the edge of the Envelope and holding down the left mouse button. This will place the squares along the edges of the envelope and allow the user to drag it to a previous date on the price chart. This feature is helpful if a trader is modeling a position they entered into on a previous date so they can see the projected one standard deviation price move from that point.
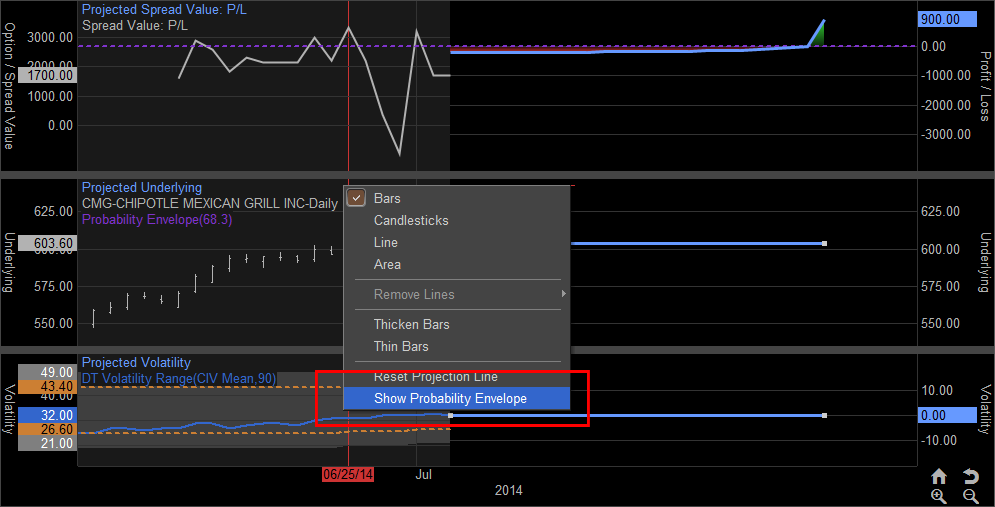
The Probability Envelope can be removed from view by right clicking on the Projected Underlying pane and unchecking Show Probability Envelope.
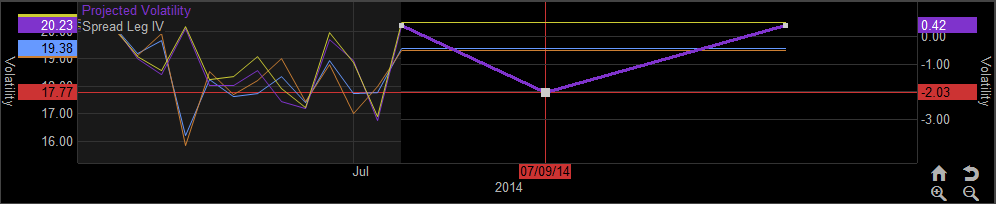
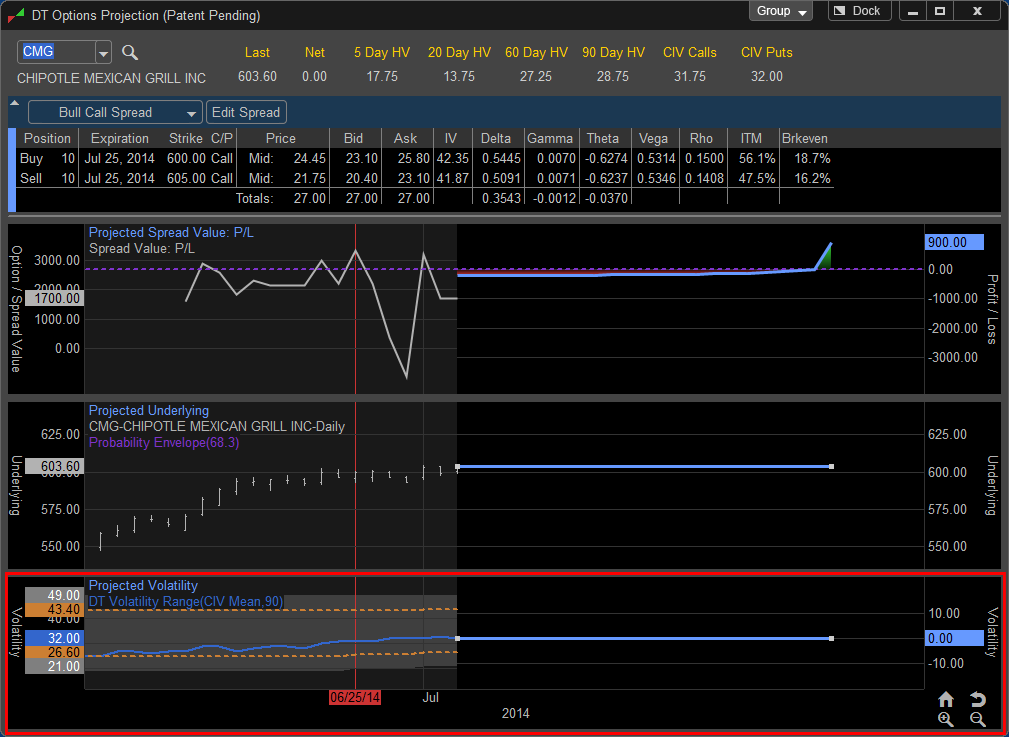
Projected Volatility
The third pane in the Projection Tool is the Projected Volatility pane. This pane displays the DT Volatility Range study which illustrates the history of the underlying symbols volatility over history. By moving the vertical cross hair over the chart the user can see the symbols volatility for the selected dates in the past. On the right hand side if the pane this area allows the trader to project changes in volatility and as a result how the change will affect the positions profit or loss over time.
The DT Volatility Range Study shows a selected volatility, in this case the 90 Day CIV Mean, in a line graph. The shaded area of the study represents the highest and lowest volatility values over the previous 90 calendar days. The orange line at the top is the upper 80% of the volatility range for that shaded area and the gold lower band is the lower 20% of that range.
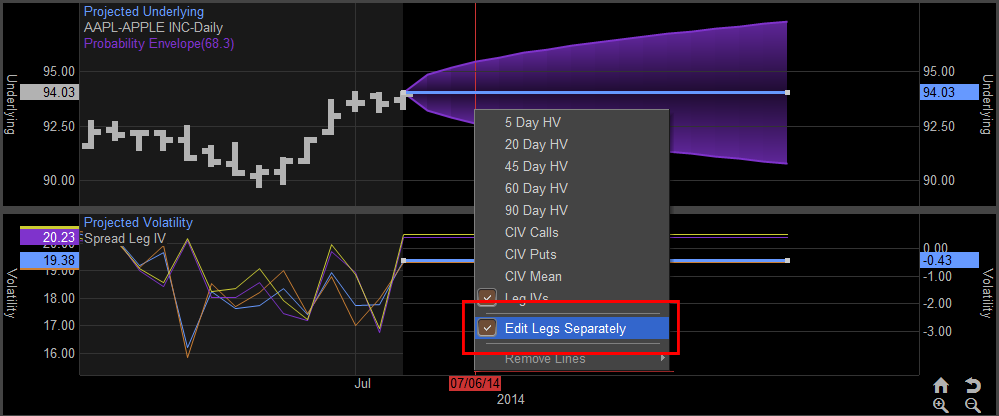
By default the DT Volatility Range Study displays volatility based on the 90 Day CIV Mean (Continuous Implied Volatility of both calls and puts averaged). The user can change this setting by right clicking in the Projected Volatility pane and choosing a new value based on preselected Historical or Continuous Implied Volatility.
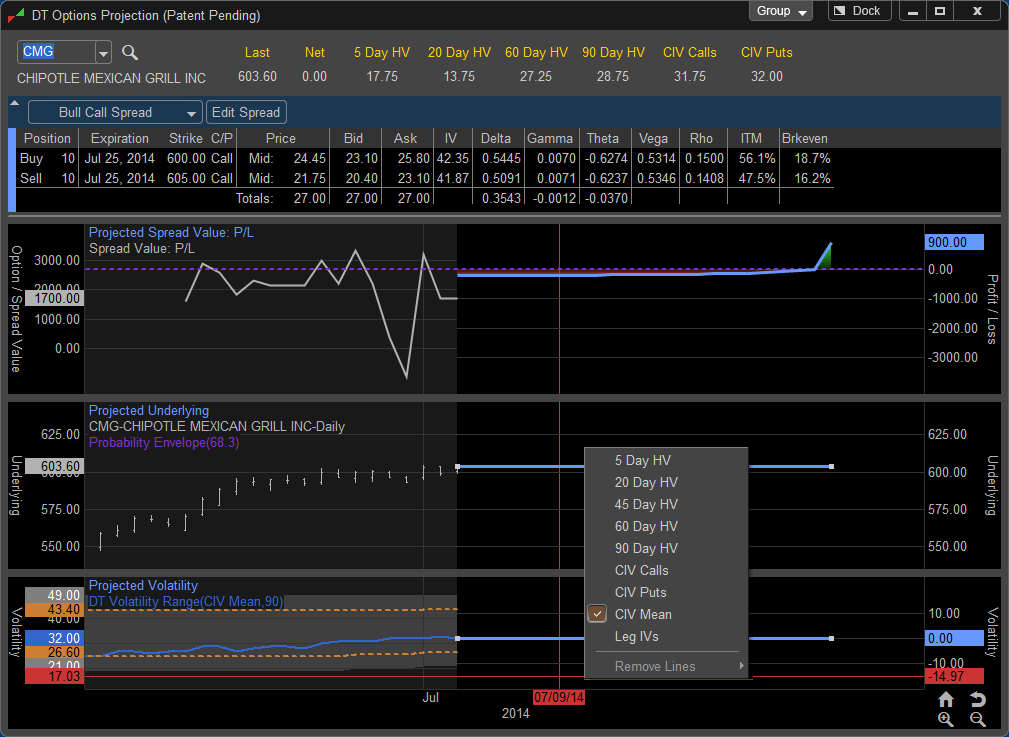
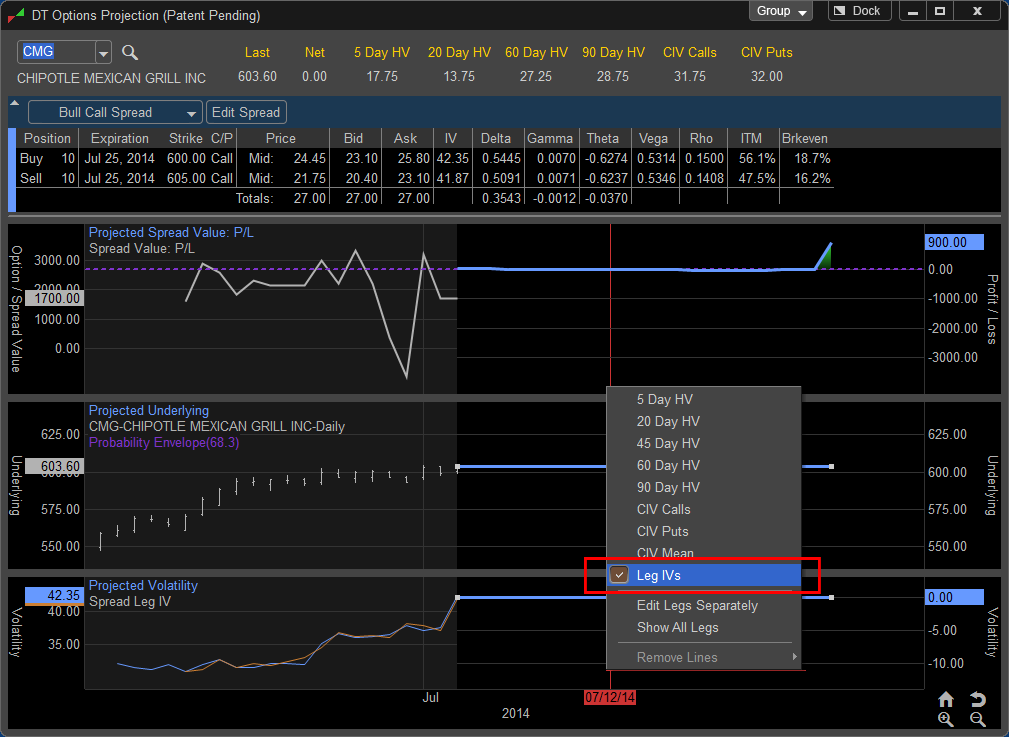
The user can also select to display the volatility of the individual option legs separately by choosing Leg IV’s. In this case since the position includes two legs you will see a history of the implied volatility for each leg of the position. The Blue and Orange Lines represent the individual legs of the displayed Bull Call Spread.
To see how a change in volatility will effect the profit and loss in the future simply move the cursor to the desired date where you anticipate volatility changing and hold down the left mouse button. Drag the volatility line to the desired change and release the left mouse button.
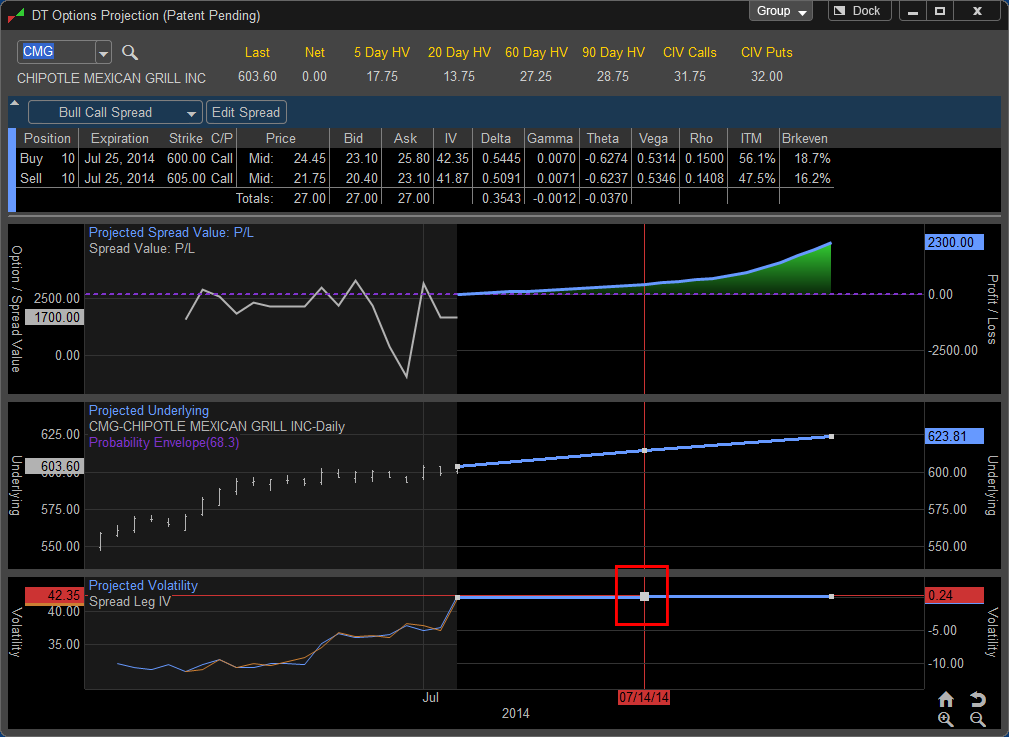
The axis on the left displays the level of the volatility for that date and the axis on the right displays the percentage change the move would represent, in this case the move lower is a 10.44% decrease in volatility. You can now see how the resulting change effects the value of the position in the first pane, in this case the declining volatility has slightly increased the profits on the trade.
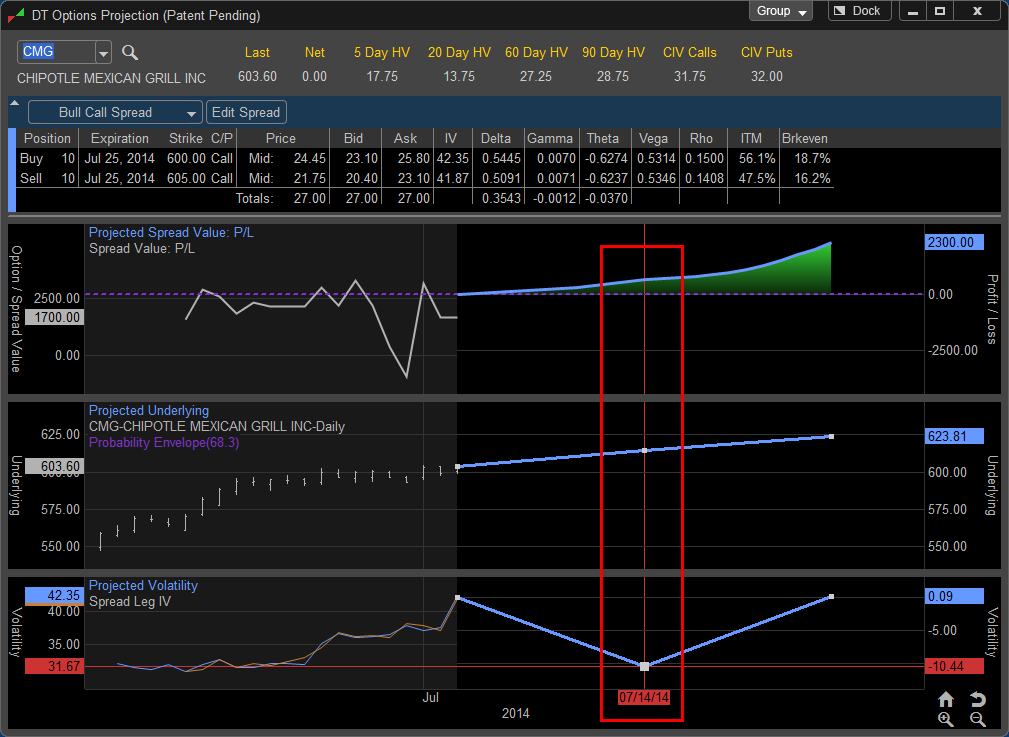
Similar to the Projected Underlying pane you can make multiple predictions to changes in volatility by moving your cursor to a second date and adjusting the volatility line to the selected levels. In this case we have simulated a move to lower volatility and a move slightly higher in late July and finally a move towards the previous highs at expiration..
You also have the option of entering in a specific volatility value by double clicking on the projection line. In this case we have entered in a 5.50% decrease in Volatility on July 15, 2014.
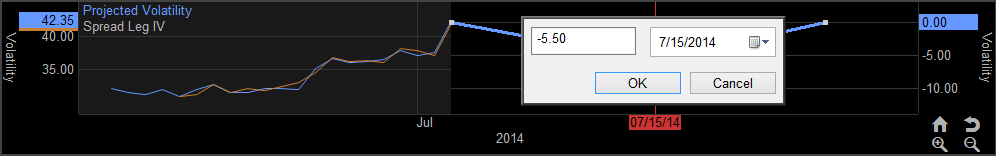
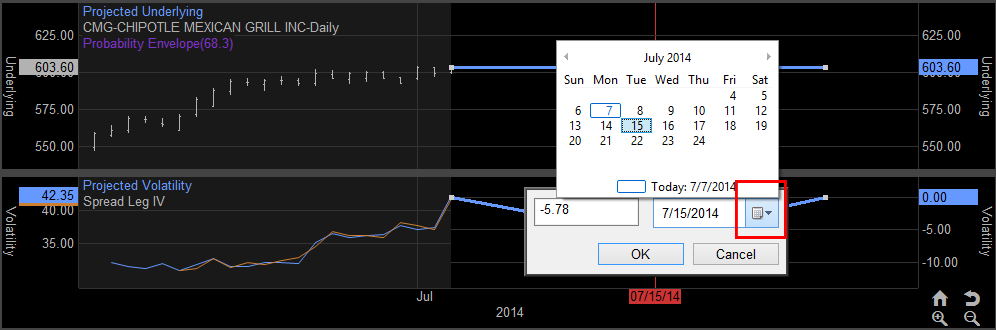
To change the date of the prediction type in the specific date in the date column or drop the calendar down by left clicking on the drop down menu. Choose the date of the volatility change by left clicking on the desired date. To change the month left click on the arrows adjacent to the month and year.
If the volatility is displayed as Leg IV’s a change in the projected volatility will result in all legs of the trade to adjust to the new projected volatility level. In this example you can see a four legged option spread has had all the legs adjusted to show a 3.01% decrease in volatility.
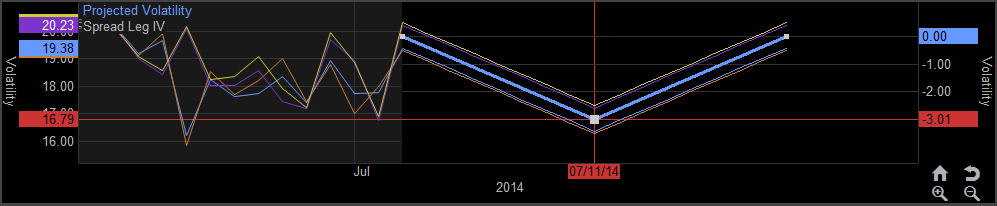
If you wish to plot changes to the legs individually you can right click in the Projected Volatility pane and choose Edit Lets Separately. This allows the user to manually adjust the volatility for each leg individually.
As you move your cursor over an individual leg the projection line will thicken, in this case the user has the mouse over the purple projection line and moving will simulate a change of volatility in that leg of the options spread.
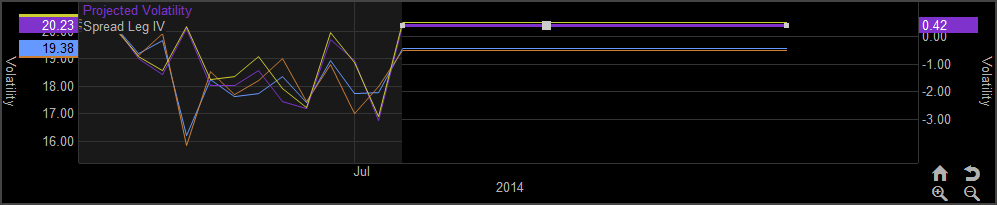
To project a change in the selected leg hold the left mouse button down and drag the projection line to the desired level. In this case we have simulated a decrease in the purple leg of 2.03%.