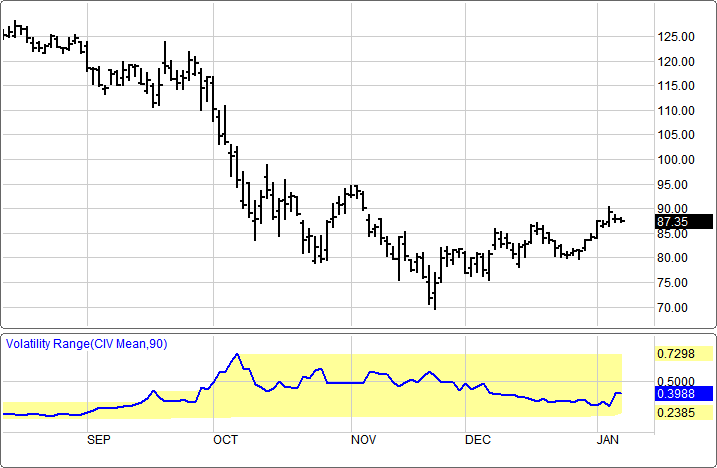
DT Volatility Range (CIV Mean, 90)
Should you buy options or sell the premiums? Should you enter into a debit or credit spread? The Implied Volatility Range study is designed to help you take the guess work out of interpreting implied volatility and, thereby, making it easier to select the most appropriate options strategy.
Implied volatility is a measure of what investors think about the future, or a representation of the market's best estimate of future volatility. While volatility is said to reflect traders perceptions for the future potential of a stock or index, it is relatively difficult to predict.
Implied volatility rises when concern about risk or fear increase, or the general market perception remains bearish. It falls when confidence increases or as long as a bullish perception remains strong.
The DT Volatility Range (CIV Mean, 90) is a very unique, proprietary technical analysis indicator designed to help the trader more quickly identify if an option is at fair value or not.
Implied volatility is that level of volatility that will calculate a fair value equal to the existing option price. Implied volatility can be considered a "consensus" type of information as it measures how expensive an option is considered in the marketplace prior to expiration. If a market becomes more volatile, implied volatility is expected to rise. As the market becomes less volatile, its implied volatility is expected to drop.
This matters to option traders because an increase in implied volatility causes a rise in option premiums. That is bad for option buyers but can be good for sellers. When implied volatility is falling, that is good for option buyers but can be bad for sellers.
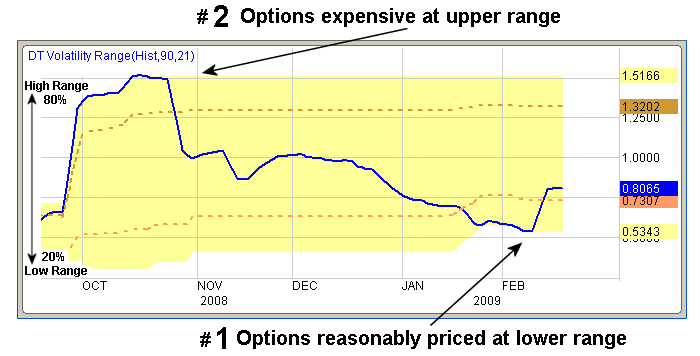
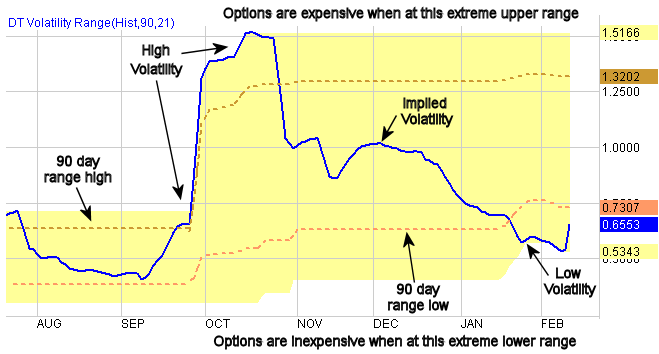
When volatility is low and begins to move to the lower 20% range, it is time to seek out and evaluate opportunities to buy options or consider something like a straddle spread strategy. (See #1) When volatility is high and begins to move to the upper 80% range, it makes sense to seek out opportunities to sell option premiums because they are now becoming very expensive. (See #2)
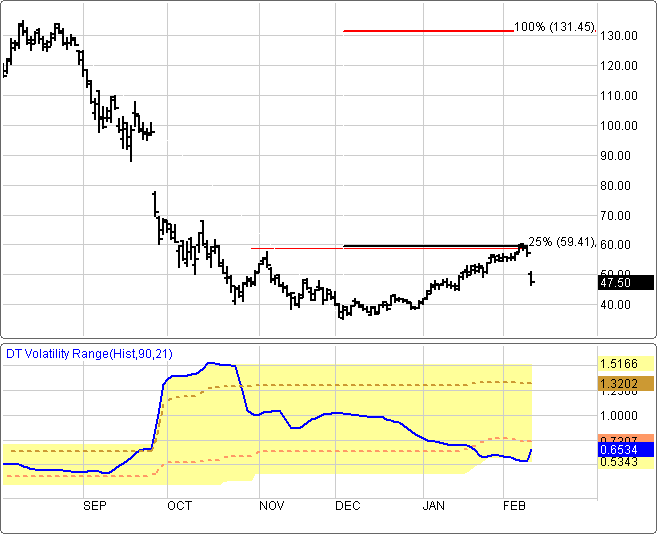
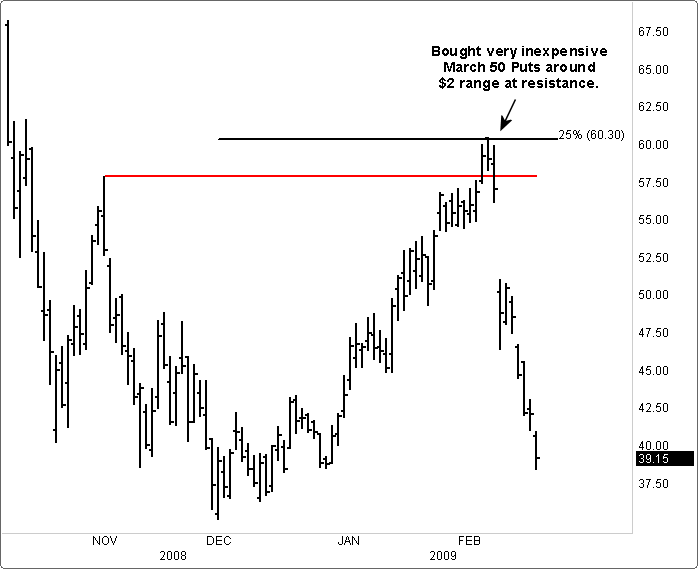
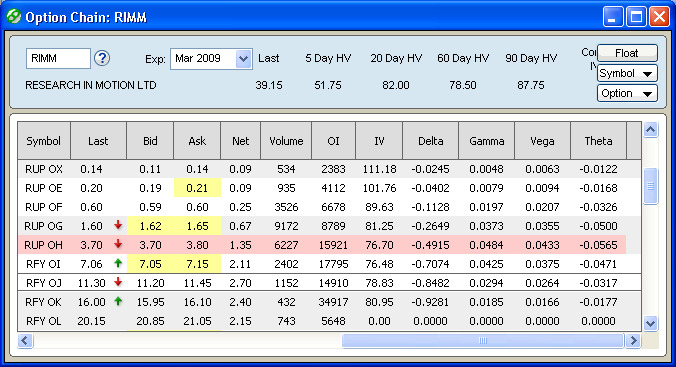
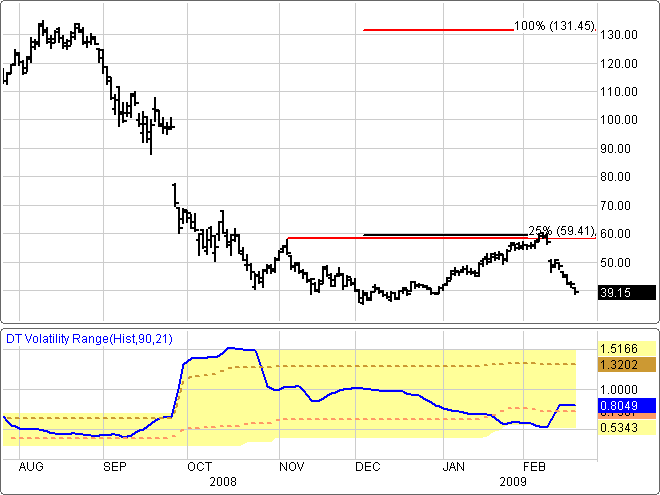
One example of how to use the DT Volatility Range indicator is the following Research In Motion (RIMM) setup. RIMM has sold off from $130 to $35 in approximately a four month period. For the next two months it begins a slow and steady incline to reach the $60 resistance area. At this point we are interested in placing a PUT strategy but we first need to find out if Put options are overvalued or reasonable. We also know that RIMM comes out with earnings in a couple days and we believe the results should not be favorable.
We look at the DT Volatility Range indicator and it identifies RIMM as being in the lower 20% range. We, therefore, are more interested in either buying Puts or attempting a net down biased spread strategy because the DT Volatility Range would suggest these options are current priced at reasonable rates.
RIMM comes out with weaker than expected earnings and its stock immediately trades down over $9 the next day. We benefit with a very nice quick profit.

As we follow-up later on this trade we see our inexpensive Put option continued to grow, in this instance, very quickly in value.
Six days after the initial breakdown our March 09 50 Put is now trading for some where near the $11.30 area. The DT Volatility Range indicator show the implied volatility is now starting to off the extreme lows yet still remains reasonably priced in general.
Menu:
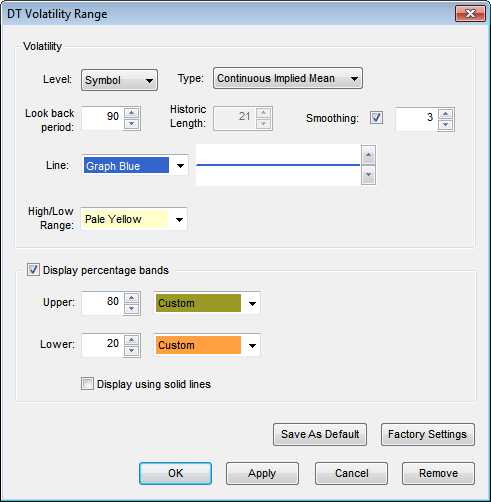
The DT Volatility Range (CIV Mean, 90) Indicator default setting uses Continuous Implied Volatility (CIV) data set to Continuous Implied Mean and uses a high/low range of the implied volatility over the last 90 days. The user can also select longer lookback periods or short periods such as a 20 day to calculate the CIV high/low range.
If the user wishes to change the DT Volatility Range (CIV Mean, 90) calculation, there are four selections to choice from: Continuous Implied Mean, Continuous Implied Calls, Continuous Implied Puts, and Historical Volatility.
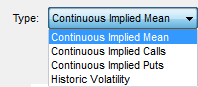
The Continuous Implied Mean setting uses Continuous Implied Volatility (CIV) data set to Continuous Implied Mean and uses a high/low range of the implied volatility. The look back period uses 90 to 120 days to calculate the CIV high/low range. Continuous Implied Mean calculates two strikes above and below the current AEM strike. It is weighted based on the distance to AEM strike.
The calculation for all four volatility types includes four expiration months including front month, weighted based on days to expiry.
Continuous Implied Mean Volatility is determined separately for Calls and Puts. The mean is CIV Calls + CIV Puts divided by 2. This gives a continuous outlook to the implied volatility of a stock, taking into consideration of both price changes and options expiring.
If one favors attempting to identify a Calls option opportunity, the Continuous Implied Calls selection adjusts the calculation for Calls.
If one favors attempting to identify a Puts option opportunity, the Continuous Implied Puts selection adjusts the calculation for Puts.
Historical Volatility most frequently refers to standard deviation of the change in the value of a market over a particular period of time. It can be expressed as an annual percentage. In the Historical Volatility selection the calculation uses a high/low range of the implied volatility. The look back period uses 90 to 120 days to calculate the CIV high/low range. Historical Volatility calculates two strikes above and below the current AEM strike. It is weighted based on the distance to AEM strike. The calculation includes four expiration months including front month, weighted based on days to expiry.
Once the range is calculated, the scan identifies stocks that are currently trading above 80% of its CIV range, indicating higher options premiums compared to the last 90 days.
If interested in Selling a Call to collect the premium, a stock identified using this filter will have a higher, more expensive Call value so would qualify as a good candidate for this type of option strategy.
If interested in Selling a Put to collect the premium, a stock identified using this filter will have a higher, more expensive Put value so would qualify as a good candidate for this type of option strategy.
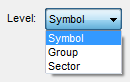
The DT Volatility Range (CIV Mean, 90) Indicator allows for three different levels in its calculation: the individual stock (1) Symbol, or the (2) Group or (3) Sector that this stock is located.
Volatility:
Level
Most symbols represent one company, such as MSFT = Microsoft, or HD = Home Depot. However, Dynamic Trend has some proprietary symbols, each of which represents potentially many stocks. Those symbols are called group and sector symbols.
A sector is a set of companies (usually a very large set, as in hundreds of them), all of whose businesses are categorized into one short and very generic description. Examples of sectors include Consumer Goods, Financials, Health Care, and Technology.
Each sector is represented by a symbol. For example, the symbol for the Financials sector is $DJUSFN, and for Technology it is $DJUSTC. Just as you can chart the price performance of one stock by entering its symbol, you can chart the combined price performance of an entire sector by charting the symbol of that sector.
Within each sector, are smaller sets of companies; those sets are called groups. Each group has a symbol, and has a name that is more specific than the sector name, about the nature of its companies' business. For example, the Financials sector has groups titled Banks ($DJUSBK), and Property and Casualty Insurance ($DJUSIP), etc. Like the symbols for sectors and companies, group symbols are able to be displayed on a chart.
The Level field allows you to display the Volatility Range for a whole group or sector, without you having to type in, or know, the symbol of that group or sector. For example, if you are currently displaying a chart of Microsoft (MSFT), and you want to display the Volatility Range for the sector that contains Microsoft (i.e. Technology), just enter "Sector" in the Level field.
If you enter "Symbol" in the level field, then you will get the Volatility Range of exactly the symbol that you entered.
The Level field applies, even if the symbol that you entered is a group symbol. For example, if you typed in $DJUSBK (i.e. Banks), and you selected "Sector" in the Level field, the program displays a graph not for Banks, but for the sector that contains Banks, i.e. Financials.
Look back period
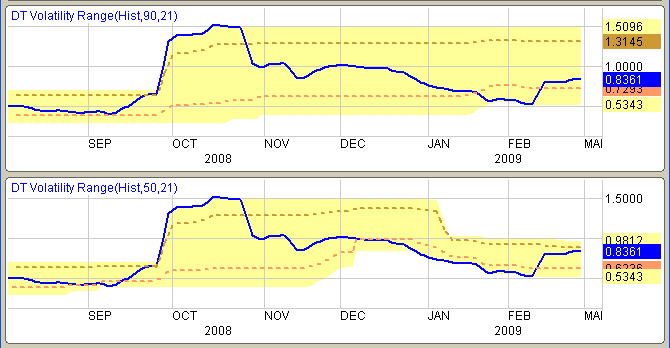
In the Volatility Range study the shaded area of the Volatility Range display, represents the highest and the lowest values that the Volatility Range has been, in a most-recent specified number of bars. That number is called the Look Back period.
![]()
So, for example, if you want the shaded area to represent how high and how low that the study has been in the last 80 bars, enter 80 as the Look back period. If you want the shaded area to represent how high and how low that the study has been in the last 120 bars, enter 120 as the Look back period. The 90 day default is what typically an options trader will look back. Some will want to look back 120 days.
Below is an example which shows the difference in yellow shading when using the 90 period setting and then applying a new 50 period selection.
Smoothing
![]()
The Smoothing selection gives you the choice of plotting either (1) an exact volatility study, or (2) a moving average of a volatility study.
To plot the study exactly, make sure that the Smoothing checkbox is not checked. In this case, the program will ignore the number in the field to the right of the checkbox.
To plot a moving average, check the Smoothing checkbox and, in the field to its right, enter the number of bars for which you want the moving average to be calculated. Usually, the higher the number you enter, the smoother the curve will look.
Historical Length
![]()
The "Historical length" field in the Volatility Range is the same as the Length field in the Historic Volatility study. The Historical length field is enabled only if the user selects "Historic" as the volatility type.
The Look back period details the number of periods to look in the past at volatility as well as the Historic Length and Smoothing.
Line
The Color selection allows the user to change the color of the band.
High/Low Range
The high/low range is displayed in a special color to easily view the range.
Display percentage bands
This can be turned on or off, the default is off.
Upper Band
The percentage can be modified between 1 - 99. The Color selection allows the user to change the color of the band.
Lower Band
The percentage can be modified between 1 - 99. The Color selection allows the user to change the color of the band.
The Bands can be displayed as hash marks (- - -) which is default, or by checking Display using solid lines they will be displayed as solid lines.
To save your modified settings to be applied to future charts, click Save As Default. Once this is clicked at all times in the future the settings you have set will be applied to future charts when this study is added.
To return to the Factory Settings, click Factory Settings and then click Save As Default. Once this done at all times in the future the Factory Settings will be applied to future charts when this study is added.
Click "Ok" to apply the study to the selected chart, or click "Cancel" or "Remove" to exit the study without applying it.
Click "Remove" to remove the study from the selected chart.