Williams Percent R this is a momentum indicator developed by a Larry Williams, popular 1980’s commodity and stock trader. This indicator measures overbought and oversold levels very similar to a stochastic oscillator and is often interpreted the same way. The differences: (1) Williams %R has an upside down scale; (2) the Stochastic scale has an internal smoothing algorithm component.
Basically, Williams %R compares a stock's close to the high-low range over a certain period of time. The typical calculation uses a 14 period default setting.
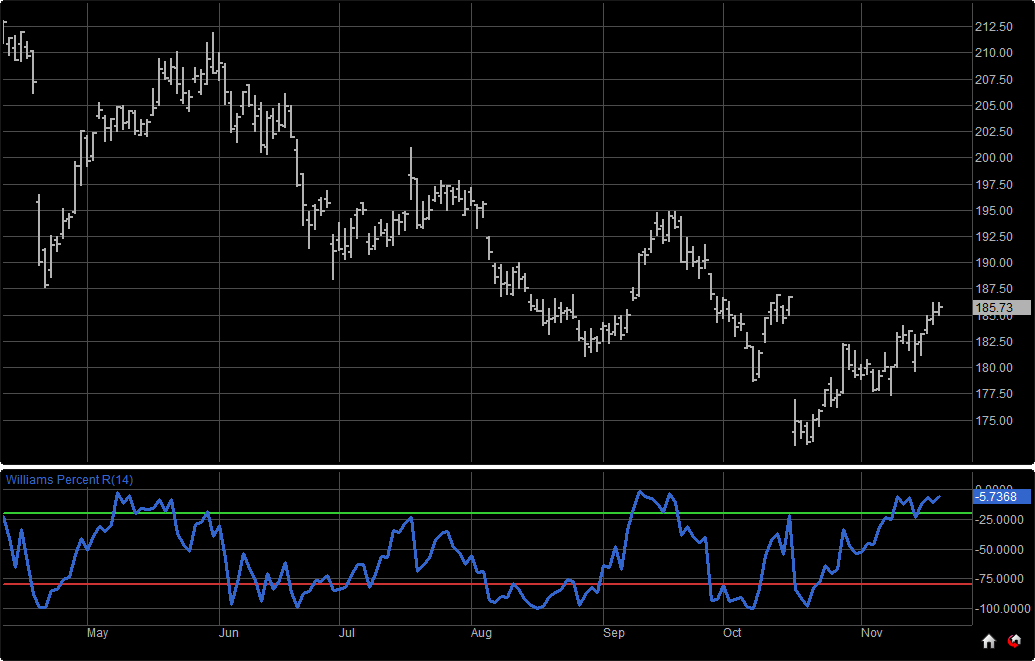
The scale ranges from 0 to -100 with readings from 0 to -20 considered overbought, and readings from -80 to -100 considered oversold.
Williams %R has an uncanny ability to anticipate a reversal. The indicator almost always forms a peak and turns down a few days before the stock price peaks and turns down. It also creates a trough and turns up a few days before the stock price turns up to form a new trend.
When a major strong trend occurs often the overbought or oversold condition will only experience minor pullbacks in the oscillator until it finally starts to unwind and lose momentum.
One confirmation method some use is to wait for Williams %R to cross above or below -50 level.
Menu:
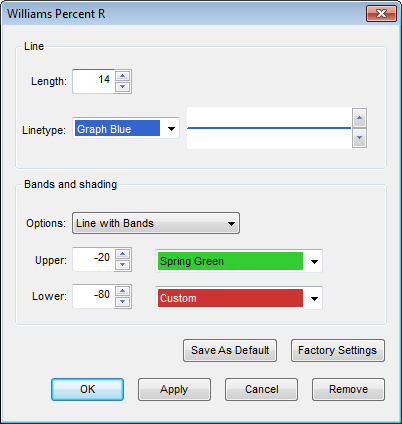
Line
The default Length is 14. The user can also change the Linetype color and thickness.
Bands and shading
The default Options is set to Line with Bands.
The default Upper band is -20.
The default Lower band is -80.
To save your modified settings to be applied to future charts, click Save As Default. Once this is clicked at all times in the future the settings you have set will be applied to future charts when this study is added.
To return to the Factory Settings, click Factory Settings and then click Save As Default. Once this done at all times in the future the Factory Settings will be applied to future charts when this study is added.
Click OK to apply the Stochastic to the selected chart or click Cancel or Remove to exit the study without applying it.
Click Remove to remove the study from the selected chart.