![]()
A trend line is a straight line that connects two or more price points and then extends into the future or past to act as a line of support or resistance. Trend Lines are an important tool in technical analysis for both trend identification and confirmation.
Lines drawn in the up-trend direction will be blue in color, while lines drawn in the down-trend direction will be red in color.
To draw a Ray, select it from the toolbar shown below. Once it is selected left click the first point on the chart then left click the second point on the chart and the line will be drawn.
Editing Lines

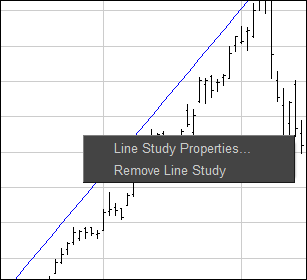
Once a line has been drawn on the Chart, right click on the line and select Line Study Properties, shown below:

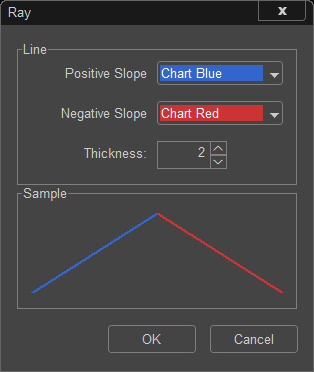
The default colors for the lines are shown to the left, a line that is positive or sloping up is Blue and a line that is negative or sloping down is Red. The Thickness of the lines that are drawn is set to 1. If a thicker line is desired, increase the thickness and click OK.